
Charts & Dashboards
Purpose: two project tabs for the reporting end of the work — Charts lists saved charts, Dashboards holds named collections of them. In the deployment this guide was written against, both are basic: they exist, they are navigable, and they are mostly empty until data work has produced something to show.
Set expectations
There is no chart-builder button on the Charts page and no chart-from-SQL action in the SQL result grid. Charts appear here when something in the product has produced them; if your Charts list is empty after building pipelines and queries, that is the current state of the feature, not a permission problem or a bug. See FAQ.
Charts
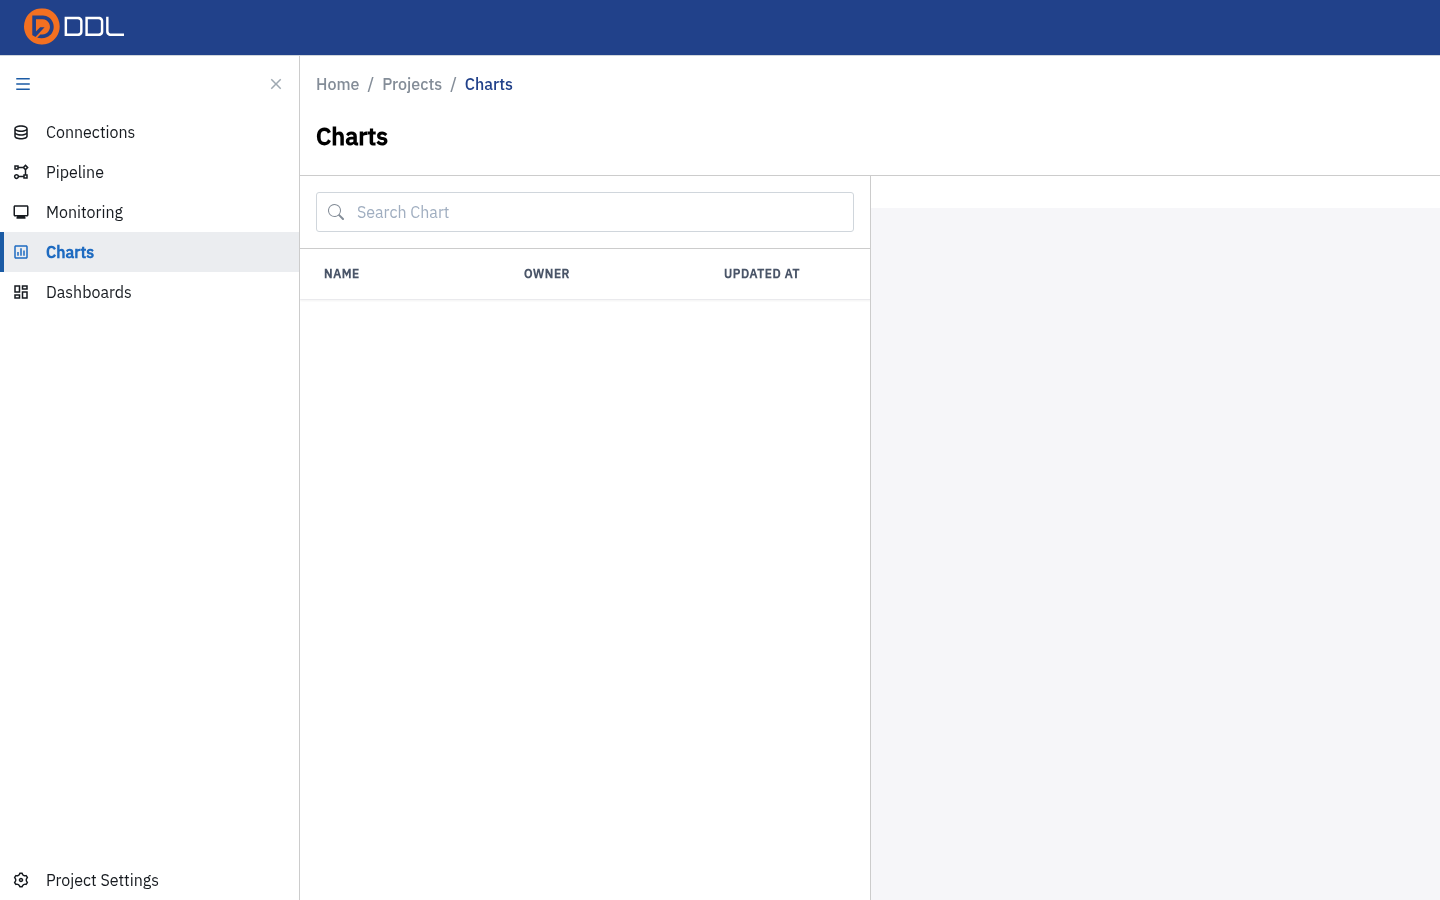 The Charts tab as it appears in a project sidebar.
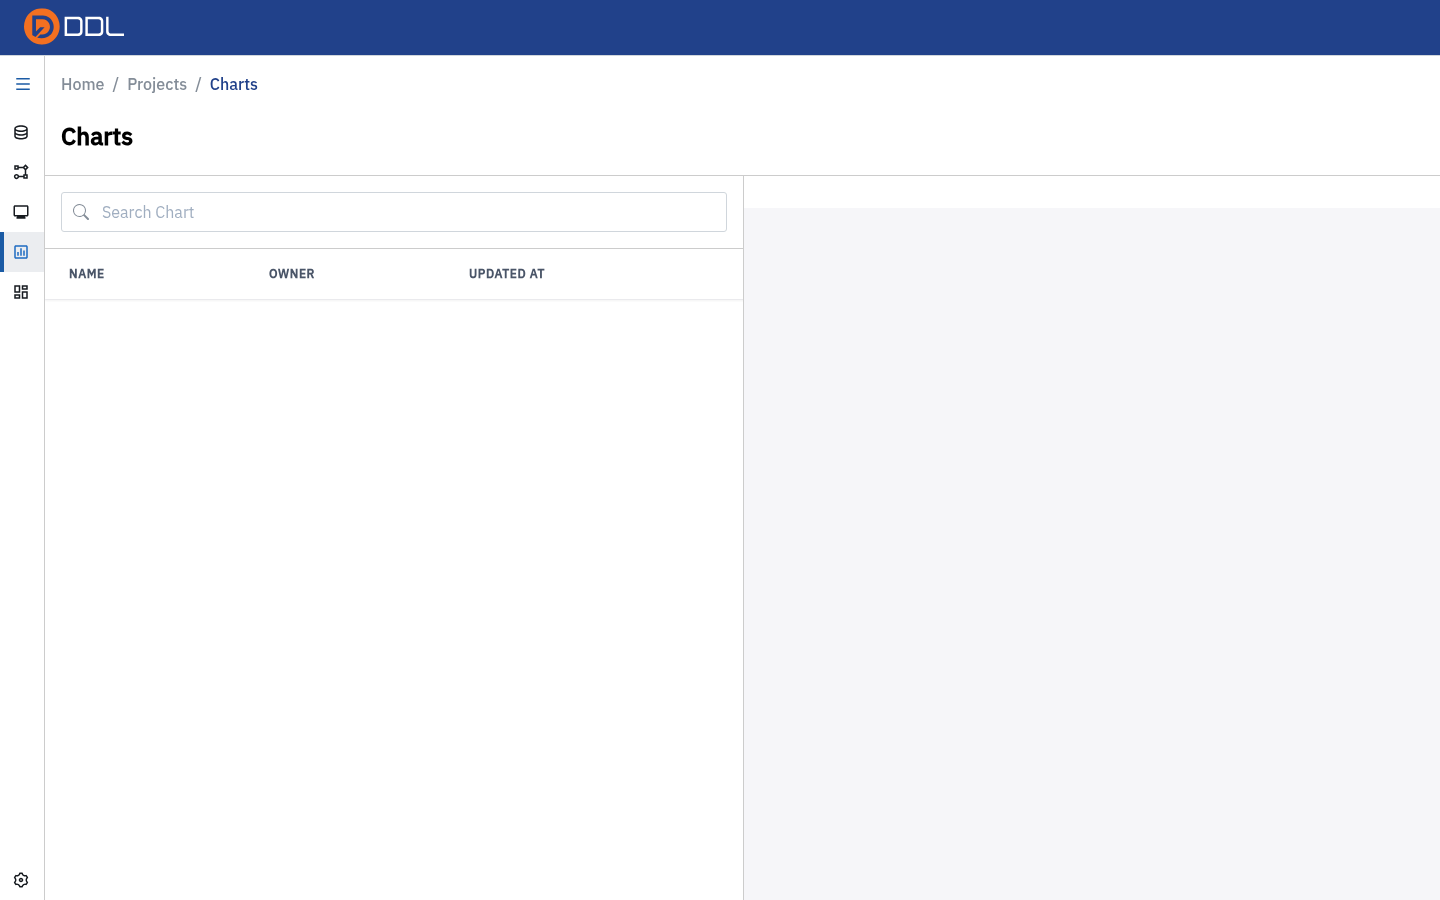 The chart table: NAME · OWNER · UPDATED AT . No create button — this page lists charts rather than making them.
| Element | Behaviour |
|---|---|
| Chart table | One row per chart: name, owner, last update |
| Empty state | No rows until a chart exists |
Practical use today: treat Charts as the inventory of visualisations your project has produced, and use SQL Query plus the pipeline for the analysis itself.
Dashboards
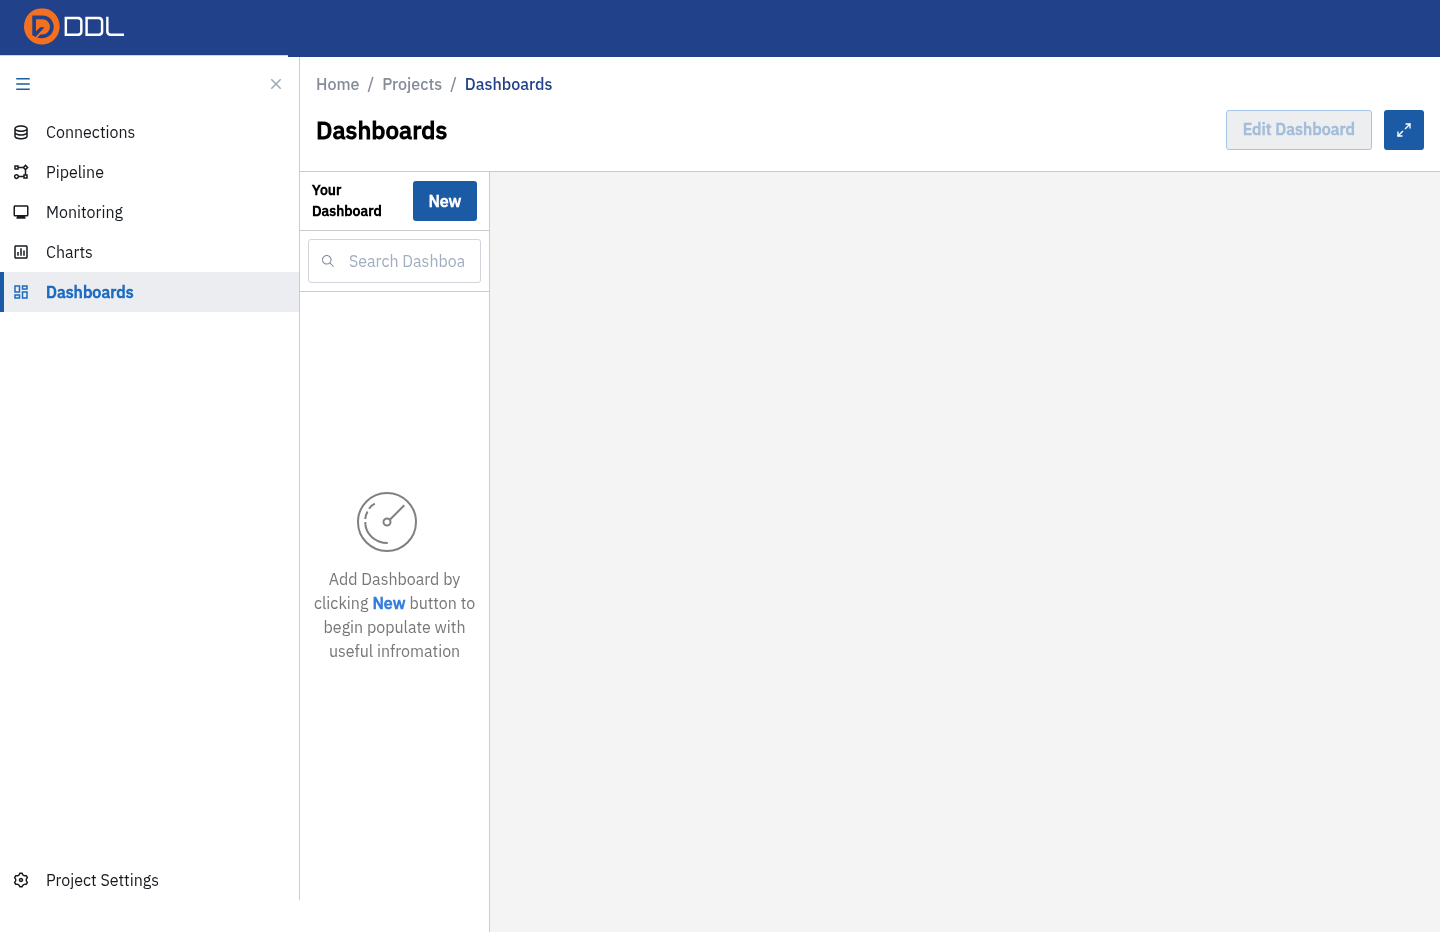 The Dashboards tab with its empty state and the New button.
- Open Dashboards and click New.
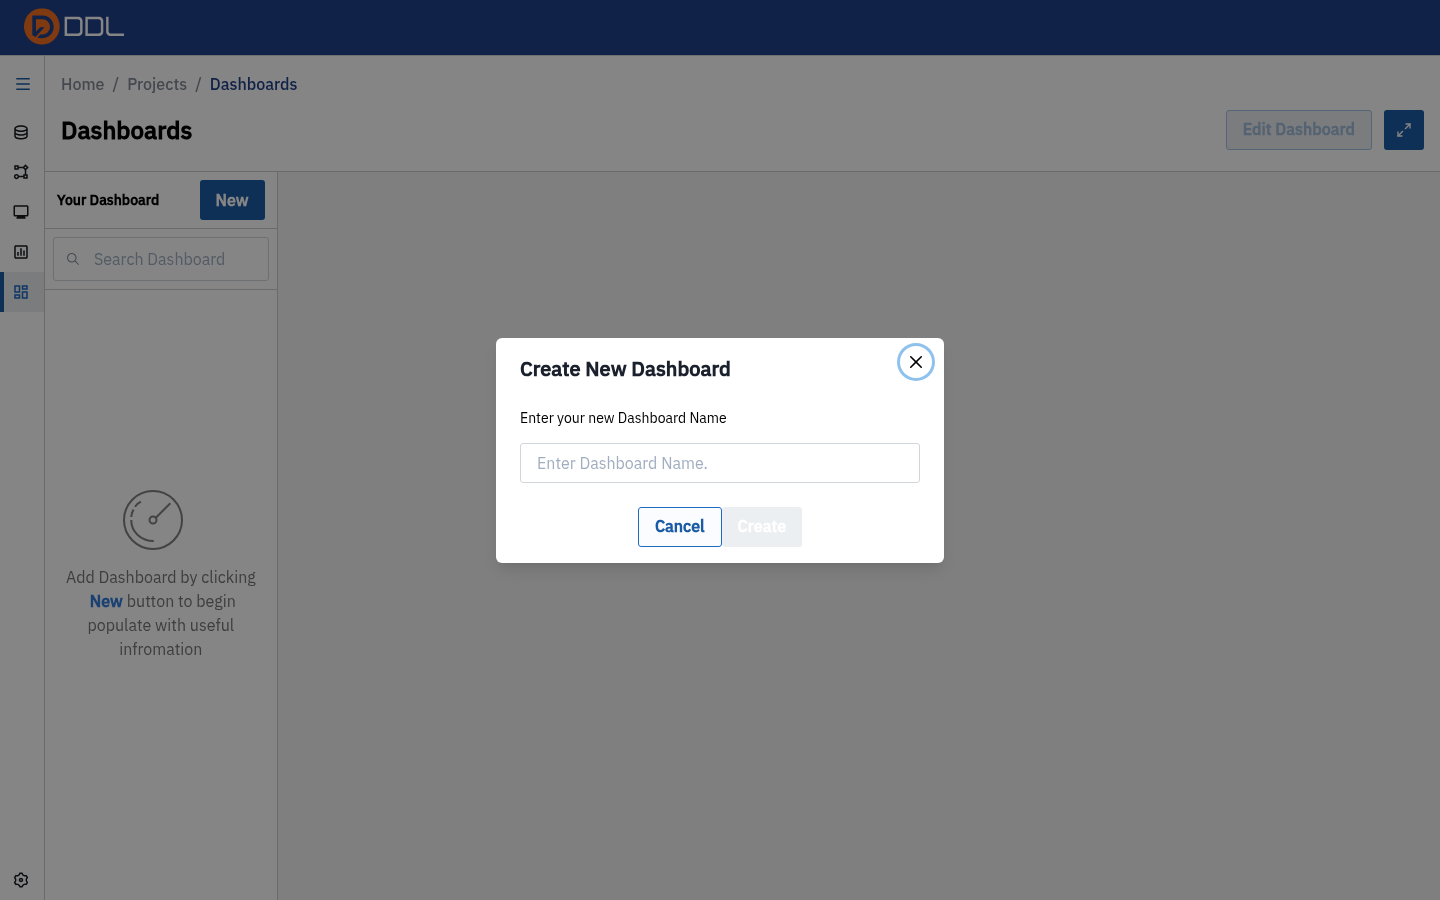 "Create New Dashboard" — enter your new Dashboard Name, then Cancel or Create .
- Type a name and click Create. The dashboard is added to the list and opens for editing (Edit Dashboard).
WARNING
The empty-state text on this page contains a typo in the product itself ("…to begin populate with useful infromation"). It is not a rendering problem in this guide.
A realistic workflow today
| Step | Where |
|---|---|
| 1. Get data in | Data Repository upload or Connections import |
| 2. Shape it | Pipelines (ETL) transforms, or SQL Query saved as a node |
| 3. Verify it | Monitoring |
| 4. Share the result | A read-only Node View link, a Dashboard, or Transfer to an export connection |
Next: Monitoring · Related: Projects, SQL Query