
Settings & usage
Purpose: the Settings area holds everything about your account rather than about a project: the AI configuration, how much storage and processing has been used, how DDL looks, and your password.
Reach it from the profile menu in the navbar → Settings (which opens /settings/ai-integration), then use the Settings sidebar:
| Sidebar item | Page |
|---|---|
| AI | /settings/ai-integration — MCP Integration, AI Agent, Activity, AI Ops → AI & MCP integration |
| Storage Usage | /settings/storage-usage |
| Process Usage | /settings/process-usage |
| Personal settings → Appearance | /settings/appearance |
| Personal settings → Change Password | /settings/change-password |
TIP
The Settings sidebar also contains organisation-level administration (users, teams and roles). That is your DDL administrator's responsibility and is deliberately outside this guide.
Storage Usage
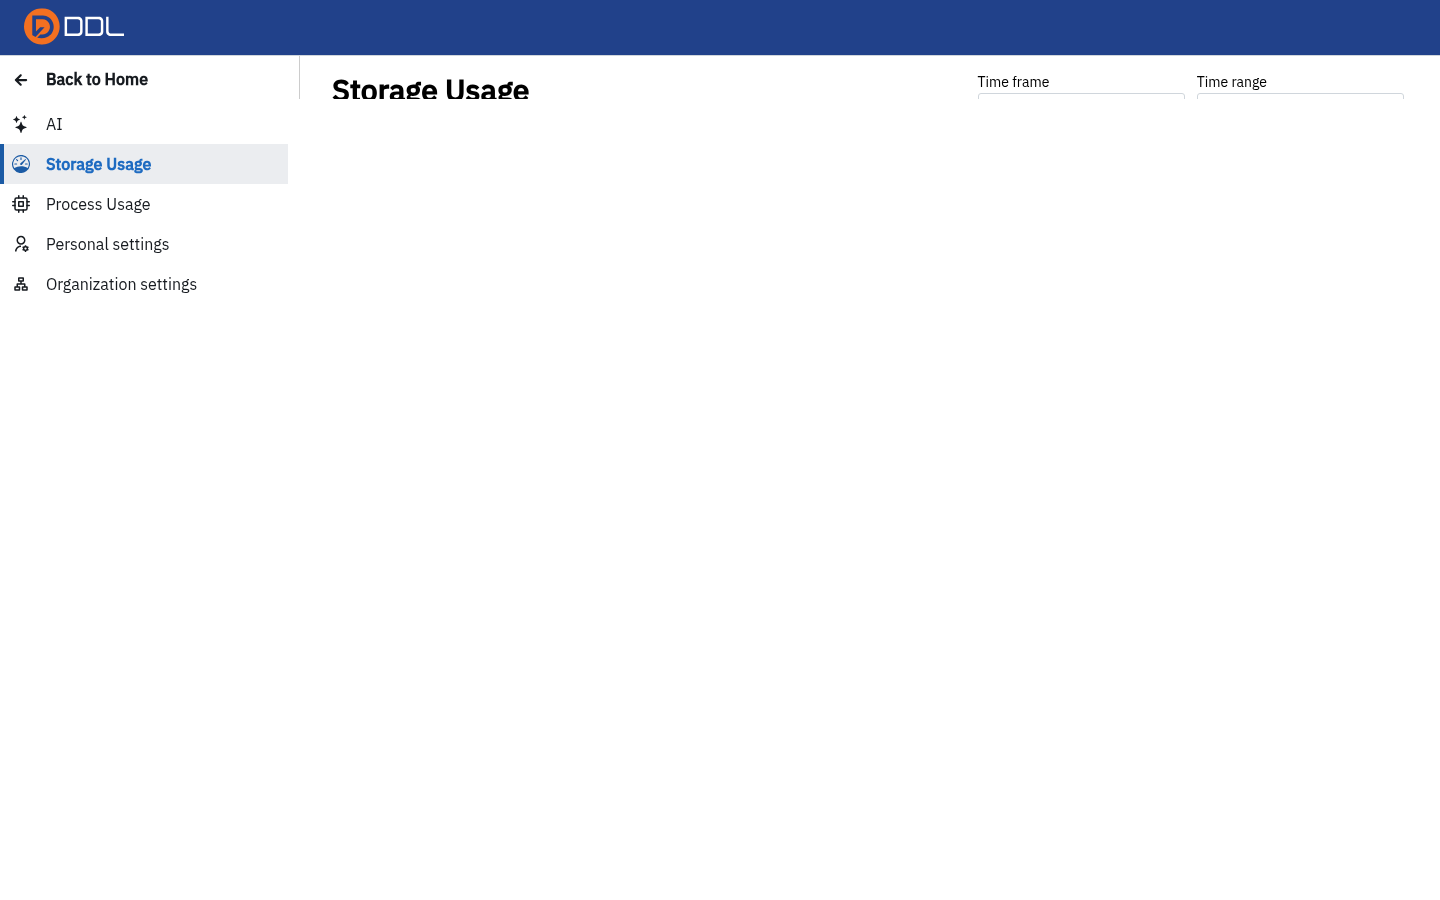 The monthly average, a daily bar chart, and the breakdown by project with PROJECT NAME · SIZE · OWNER and pagination.
| Element | What it shows |
|---|---|
| Headline | "Average storage used for this month", e.g. 58.9MB |
| Time frame | Granularity of the chart (e.g. Daily) |
| Time range | Window of the chart (e.g. Last 30 days) |
| Bar chart | Storage per day over the window, with a labelled axis |
| Breakdown table | Size per project, with owner, stamped at one absolute moment in time |
Two things to expect on this page
- It is instance-wide, not per-user. The breakdown lists projects owned by other people — including ones that do not appear in your own
/projectslist. That is normal on a shared instance and does not mean you can open their projects. See the FAQ. - It will not match the navbar meters. The meters show your live usage and often read
0B; this page reports the instance's history. Neither number is wrong; they answer different questions.
Use it to answer: what is eating storage, and which project should I clean up.
Process Usage
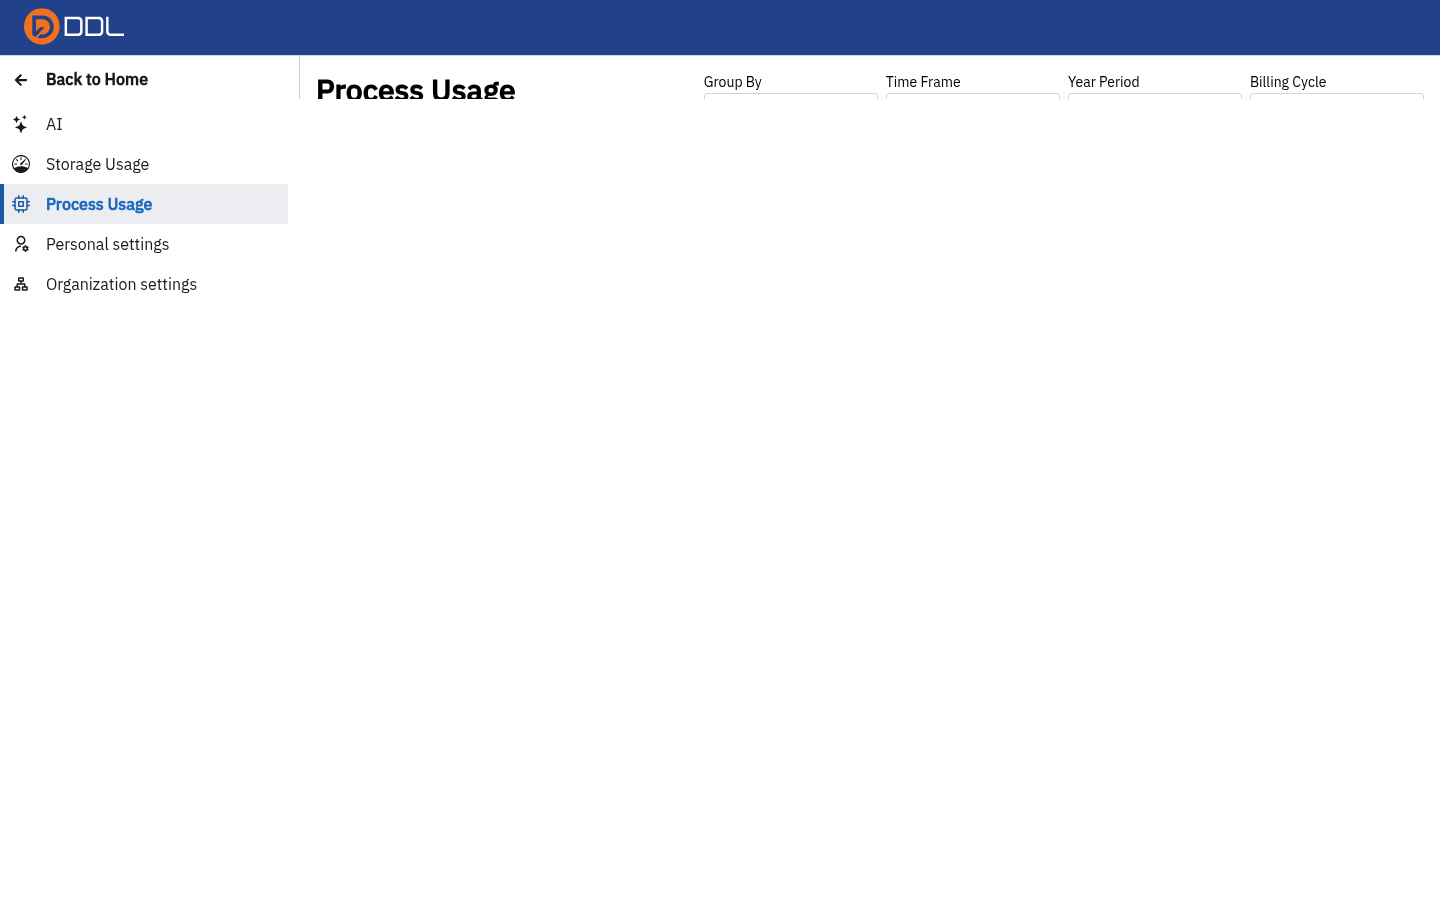 Group By / Time Frame / Year Period / Billing Cycle controls, the cumulative chart, and the per-process-type table.
| Control | Values seen |
|---|---|
| Group By | Process type |
| Time Frame | Daily (Cumulative) |
| Year Period | e.g. 2026 |
| Billing Cycle | e.g. "18 Nov - Now" |
| Summary | "Total processing time from start of billing cycle (period)" plus the next quota reset |
| Table | PROCESS TYPE · TIME PROCESSING · PROCESSING PERCENTAGE |
Processing usage is reported with a delay
Real SQL executions can still leave this page showing 0 seconds (with one row at 100.0%), because sub-second runs round down and the quota is not updated instantly. Do not treat a zero as proof that nothing ran — check Monitoring, which lists the runs themselves.
Appearance
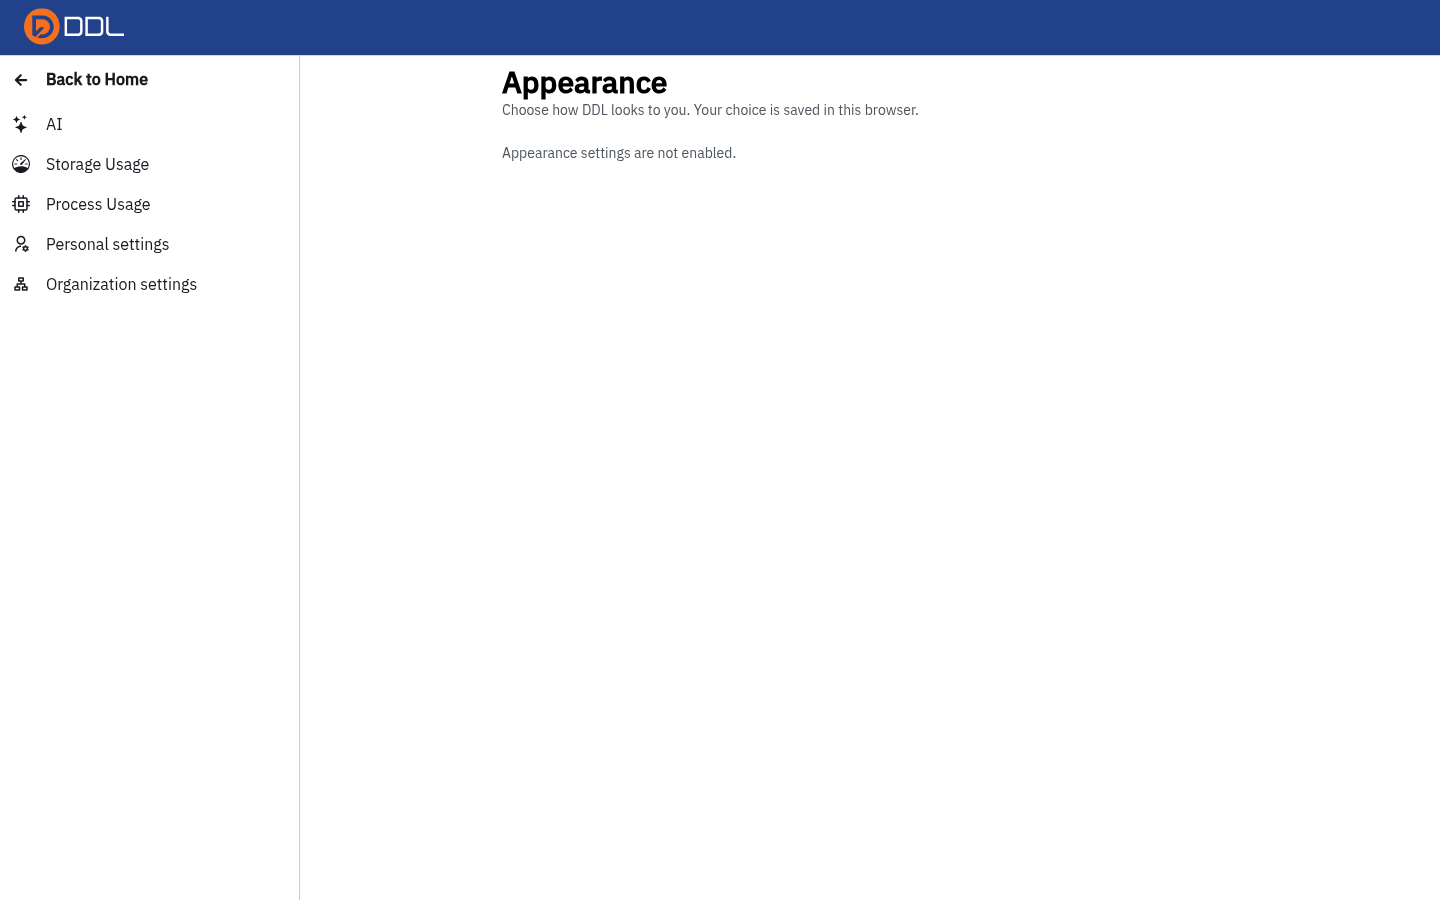 The page exists, and its body reads "Appearance settings are not enabled."
The intent, in the page's own words: "Choose how DDL looks to you. Your choice is saved in this browser." In this deployment the theme picker is not enabled, so there is nothing to choose. If you need a dark theme for accessibility reasons, raise it with your DDL administrator — it is a deployment configuration, not a user setting you can flip.
Change Password
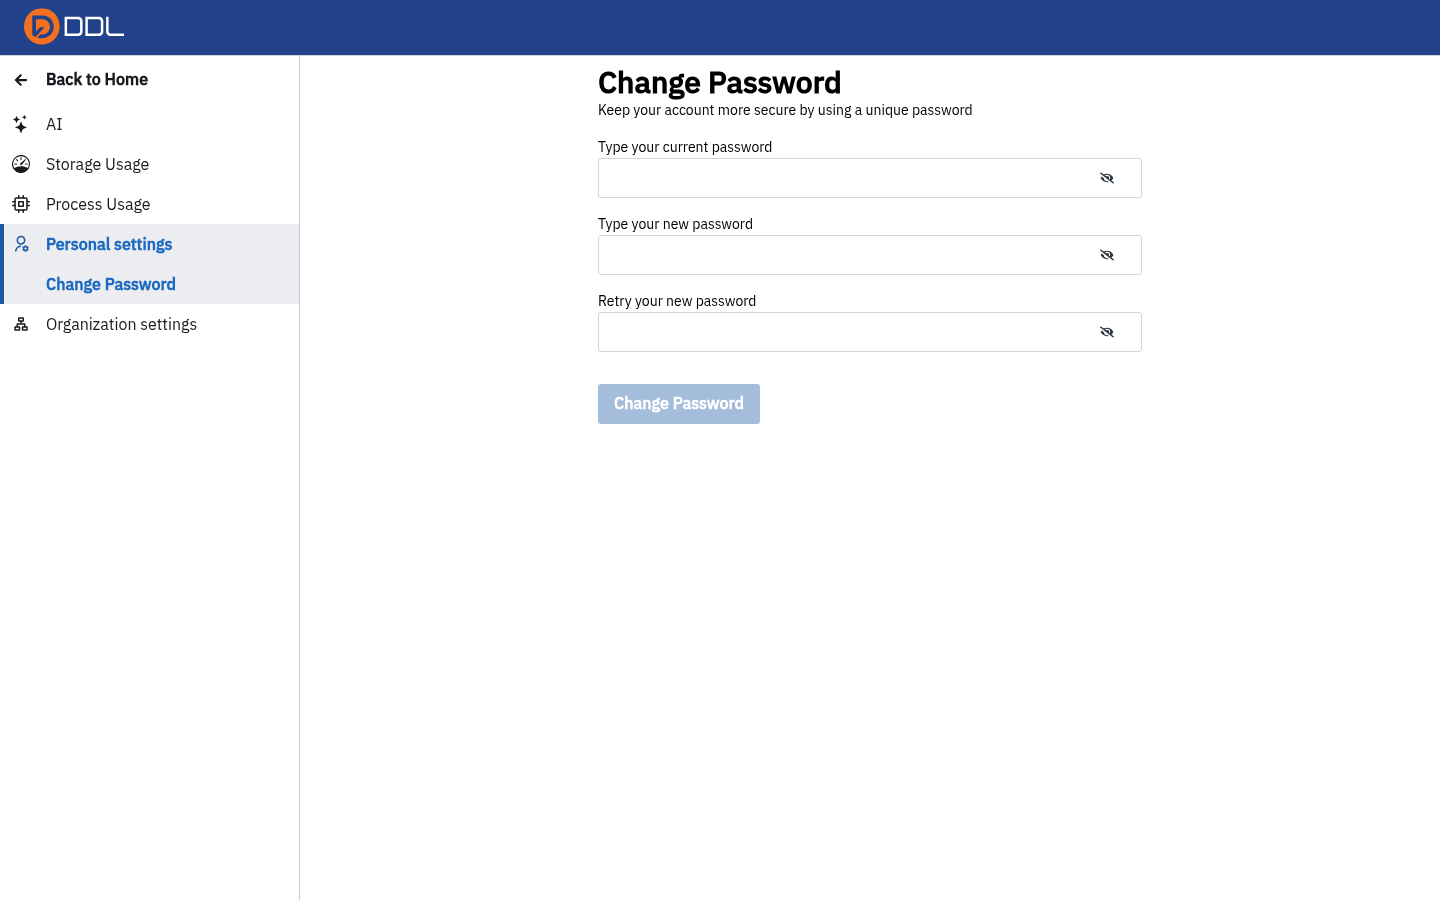 Three fields — current password, new password, repeat new password — and the Change Password button. Fields are empty until you type.
- Open Settings → Change Password.
- Enter your current password, then the new password twice.
- Click Change Password.
Password hygiene
- Use a unique password; the page's own prompt says "Keep your account more secure by using a unique password".
- Never send a password (or a screenshot containing one) to support.
[email redacted]will never ask for it. - If you have forgotten it, use the Forgot password flow from the login screen instead of guessing repeatedly.
What consumes what
| You did | Shows up in |
|---|---|
| Uploaded a file to the repository | Storage Usage and the Data Repository list |
| Ran a SQL query | Process Usage (delayed) and Monitoring (immediately) |
| Synced or transformed a node | Process Usage + Monitoring as Import / Transform processes |
| Dumped data or transferred a node | Monitoring as Export / Transfer processes |
| Used an MCP client or the assistant | Settings → AI → Activity |
The honest summary of the meters
Navbar meters = you, live, rounded. Storage Usage / Process Usage = instance, historical, delayed. Monitoring = the actual list of runs. When they disagree, Monitoring is the one that tells you what really happened.
Next: FAQ & troubleshooting · Related: AI & MCP integration, Monitoring