
FAQ & troubleshooting
Short answers to the questions DDL users actually ask, plus the quirks that look like bugs but are not. If you are new to DDL, read the first three entries before anything else.
Quick answers
| Question | Jump to |
|---|---|
| My query says the table does not exist | Backticks |
| Create New made a project without asking me a name | Project creation |
The navbar says 0B used but I have data | Meters |
| There is no AI chat button for me | AI assistant |
| AI Ops counts Chat calls I never made | Activity vs AI Ops |
| Storage Usage lists projects that are not mine | Aggregate views |
| A page says "not enabled" | Feature flags |
Ctrl+K did not open a command palette | Keyboard shortcuts |
| Something is genuinely broken | Contact support |
Why does SQL say relation "demo_orders" does not exist?
Because the table name was not written as a back-quoted node name. DDL accepts FROM `demo_orders` and rejects the bare name, the double-quoted name and the schema-qualified name — all three fail with the same PostgreSQL error even though the node is plainly on the canvas.
| You wrote | Result |
|---|---|
SELECT * from `demo_orders` LIMIT 25 | ✅ works |
SELECT * FROM demo_orders | ❌ relation does not exist |
SELECT * FROM "demo_orders" | ❌ relation does not exist |
SELECT * FROM ddl.demo_orders | ❌ relation "ddl.demo_orders" does not exist |
Fix: use backticks, or expand the node in the Nodes panel → ⋮ → View Data and let DDL write the statement. Full explanation: SQL Query.
Why did Create New make a project without a dialog?
That is the designed behaviour: Create New creates a project immediately with an auto-generated name (Project 1, Project 2, …) and navigates straight into it. There is no name prompt to fill in, and no cancel step.
Fix: rename it right away — Project Settings → Change Project Name → Save. The same applies to the dashed Create New Project / Click here tile on the home dashboard. Details: Projects → Create a project.
Why do the navbar meters say 0B used?
The Storage and Processing meters in the navbar reflect your current usage, and they round: a SQL run that finishes in under a second contributes 0 Mins. So you can see 0B used / 0 Mins used while Settings → Storage Usage reports tens of megabytes for the month.
| Number | Scope | Timing |
|---|---|---|
| Navbar meters | you | live, rounded down |
| Storage Usage | instance | historical, daily buckets |
| Process Usage | instance / billing cycle | delayed, sub-second runs round to 0 |
| Monitoring | the projects you can see | the actual list of runs |
Takeaway: never use the meters to prove something did or did not run. Use Monitoring.
Why is there no AI Assistant chat in my DDL?
Because the in-app assistant is deployment-dependent. The chat UI ships in the product but is only rendered when the deployment configures the assistant service; DDL states this directly at Settings → AI → AI Agent → Engine status:
Service —
AI_ASSISTANT_URL is not set for this DDL, so the AI Assistant is hidden— Not configured
So on such an instance there is no floating "Ask DDL AI" button, no panel, and no keyboard shortcut that opens one — in the app, in the pipeline, or in the SQL editor. It is not a permission problem and it is not broken.
What you can still do: use MCP integration to connect Claude Code, Claude Desktop, Cursor, VS Code, OpenCode, Codex, Gemini CLI, Windsurf or any other MCP client to DDL with your own access token. Ask your DDL administrator whether the assistant service can be enabled for your instance.
AI Ops shows Chat calls but I have no AI chat
Two different scopes, one page each:
| Tab | Scope |
|---|---|
| Activity | Your AI tool calls — MCP clients, the AI Assistant, AI Action. Empty if you have used none |
| AI Ops | The whole instance: every user, every project, including historical calls recorded before your account existed |
On the instance this guide was written against, Activity was empty while AI Ops reported 211 calls including 107 labelled Chat. Both are correct. Do not read AI Ops as evidence about your own account — and do not be surprised when it names users and projects you cannot open.
Details: AI & MCP integration.
Why do I see projects I never created in Storage Usage?
Because Storage Usage, Process Usage and AI Ops are instance-wide reports. They aggregate every project on the DDL instance — including projects owned by other people — while /projects lists only the projects you own or have been shared with.
A shared staging instance therefore shows a long tail of other teams' work in the totals. It does not mean you have access to those projects, and it does not mean your storage is being used up by them. If the totals matter to you (quota, cost, capacity), ask your administrator which scope each report uses.
Why do some pages say a feature is "not enabled"?
DDL ships more features than every deployment turns on. Verified examples:
| Page | Message | Meaning |
|---|---|---|
| Appearance | "Appearance settings are not enabled." | The theme picker exists in code but is disabled for users here |
| Distribution | "Distribution is not enabled — Ask your administrator to turn on the Distribution feature." | Audience/export distribution is feature-flagged off |
| Billing | The branded 404 page | No billing UI is deployed in this build |
| Deploy | A bare "Project Name / Open Sidepanel / Content Section" scaffold | The page is unfinished in this build |
What to do: treat these as deployment configuration. Your administrator can confirm whether the feature can be switched on for your instance; nothing on the page itself will enable it.
Is there a command palette or any keyboard shortcuts?
No command palette. Ctrl+K (or Cmd+K) focuses the "Search Dataset" select on the pages that have one — the pipeline canvas, the Data Repository and the SQL Query panel — and does nothing else. Ctrl/Cmd+J (the assistant shortcut) does nothing on instances without the assistant.
Practical alternatives: the project sidebar, the profile menu for Settings and Monitoring, and direct URLs — /home, /projects, /data-repository, /monitoring, /projects/<id>/sql-query.
Why is Monitoring empty right after I clicked Sync now?
Because runs are queued and Monitoring is eventually consistent. The toast "Node … sync process will be started shortly" only means the request was accepted.
Fix: wait, then refresh. Do not launch the sync again because the row is missing — you will end up with two runs. Also note that Monitoring renders relative times ("15 minutes ago") while Storage Usage and Versions use absolute timestamps; the absolute time is inside the log body.
Why can't I retry a failed run from the log drawer?
There is no re-run/retry control in the Monitoring log drawer. Re-run from the source instead: Sync now on the node (Pipelines) or Run in the SQL editor (SQL Query). The drawer is for reading and downloading the log.
Where is "Open node page"? It is greyed out.
Expected for a node imported from the Data Repository: the context menu item renders but is disabled. Use View in the node's side panel — it opens the same read-only Node View page, which is shareable and safe to send to people who should not edit anything. See Pipelines → Inspect a node in read-only mode.
Union gives me a 404
Union is not under the project path. Reach it through Transform → Union on the canvas; the editor lives at /union/<projectId>. Typing /projects/<id>/union produces the branded 404 page. Any unknown URL does the same — Back to Home gets you out.
Why is the Charts page empty?
Because in this deployment Charts and Dashboards are basic: the Charts page is a list (NAME · OWNER · UPDATED AT) with no create button, and the SQL result grid has no "make a chart" action. Dashboards do let you New → name → Create.
For sharing results today, use a read-only Node View link, a saved query as a node, or Transfer to an export connection. See Charts & Dashboards.
Can I export a SQL result to CSV?
Not from the SQL workbench — there is no export/download control on the Data tab. Workarounds:
- Save the query as a node, then use Transfer to push it to an export connection, or Versions → Dump Data for an export job.
- Ask for the source file back from the system the data came from.
Details: SQL Query → What the SQL workbench does not do, Pipelines.
My dataset is missing from "Add data → Data Repository"
The Data Repository is account-wide, so the list you see there is what exists — not what your project has used. Check /data-repository and search for it; if it is genuinely absent, upload it (Data Repository → Upload a file). Note that repository contents differ between instances: sample or mock datasets from documentation or from another environment will not be present in yours.
Is it normal for the AI to be able to delete things?
Only if you granted that level. An MCP token's access level decides it: Read cannot change anything, Write can create, rename, clone and delete projects, nodes and connections, and Script additionally runs Python scripts unsandboxed on DDL workers. Administrators can cap the highest level allowed instance-wide.
Review your tokens periodically and revoke anything unused (AI & MCP integration).
How do I report a problem?
Use Report Problems in the navbar profile menu — it opens your mail client addressed to [email redacted] with a pre-filled subject. (The subject line contains the word Mandala, the product's internal codename; leave it in, it helps routing.)
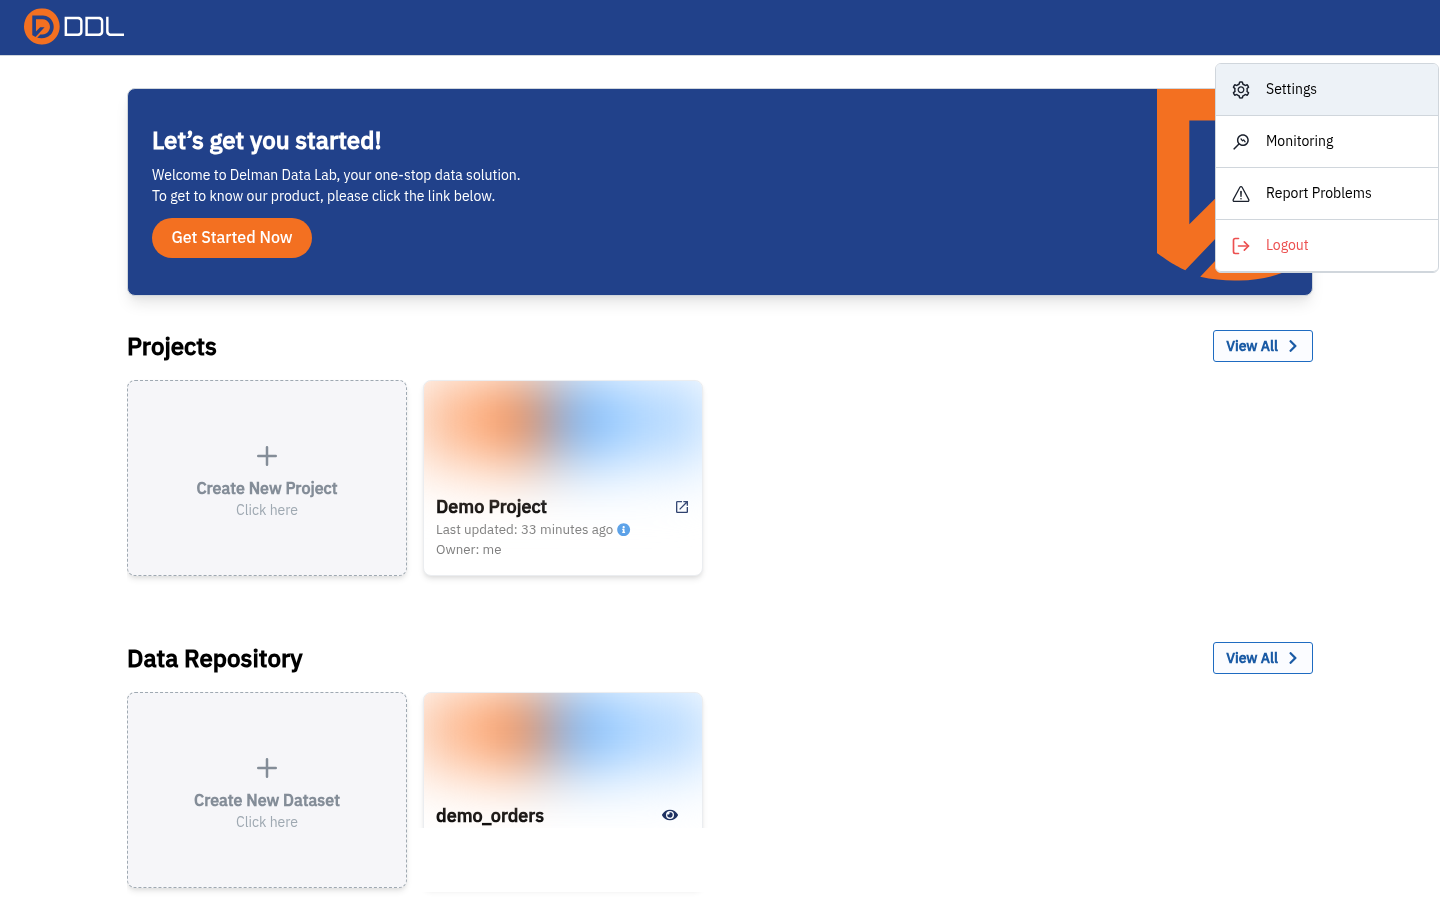 Settings · Monitoring · Report Problems · Logout.
Include as much of this as you can — each item is one click away:
| Include | Where to get it |
|---|---|
| Query ID / process UUID | SQL Details tab, or the Monitoring log drawer header |
| The log URL | Copy the Monitoring URL — it contains ?process_id=<uuid> and reopens the exact drawer |
| Full log text | Download Log in the log drawer |
| Project name and node name | Project header and canvas |
| What you expected vs what happened | plus the approximate time (remember Monitoring shows relative times) |
| Your username and role badge | Shown in the navbar |
Never include secrets in a report
Do not paste your session token (TESSERACT_AUTH), AI access tokens, connection passwords, or screenshots that reveal them. Support will never ask for a password.