
Getting started
Goal: go from an empty browser tab to a project containing a real dataset that you can query, in about fifteen minutes. You will log in, look around the home dashboard, create and name a project, upload a CSV to the Data Repository, import it into a pipeline, and run your first SQL query against it.
What you need: your DDL credentials and a small .csv, .xlsx, .xls, .json or .parquet file you are happy to upload.
1. Log in
Open your DDL address (for example https://ddl.delman.io) and sign in.
- Type your username and password into the two fields.
- Submit the form. You land on
/home.
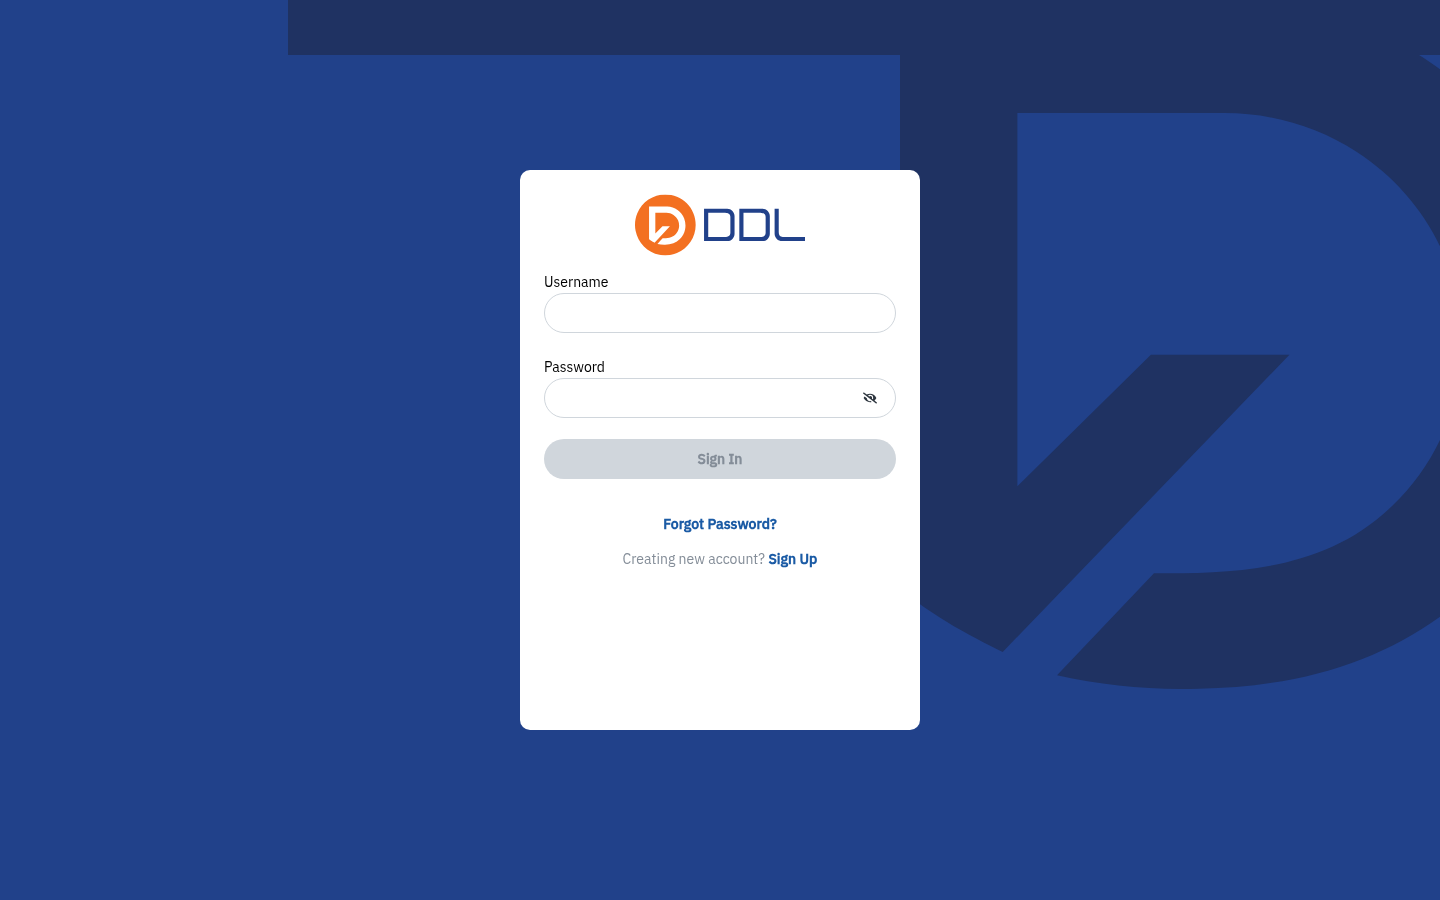 The login screen. Your account is created by a DDL administrator; use Forgot password if you need to reset it.
Do not paste your session token anywhere
DDL keeps your signed-in session in the browser's localStorage under TESSERACT_AUTH. It is a credential. Never copy it into a support e-mail, a screenshot or a bug report.
2. Look around the home dashboard
/home is your starting point every day. It has four parts.
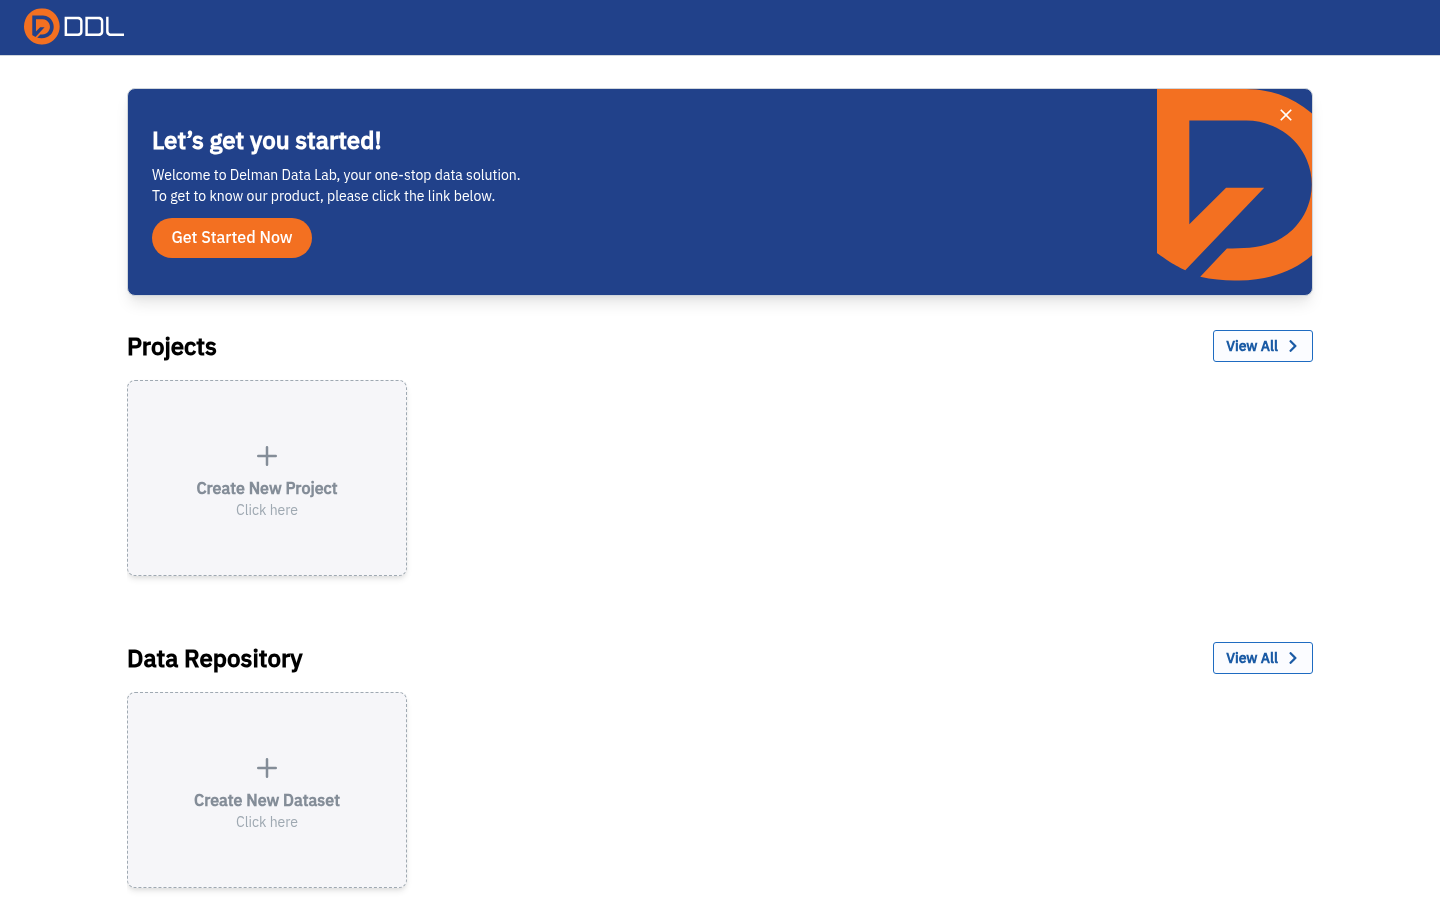 The home dashboard for an account with no activity yet: navbar meters at the top, then the Projects and Data Repository sections.
- Navbar (always present) — the DDL logo (back to the landing page), the Storage and Processing meters, and your profile button showing your user name and role badge.
- Onboarding banner — "Let's get you started!". Dismiss it with the ✕, and bring it back with the round (?) icon in the navbar.
- Projects — recent project cards plus View All →
/projects. On a fresh account the section shows a dashed Create New Project / Click here tile. - Data Repository — recent dataset cards, View All →
/data-repository, and a Create New Dataset tile that opens the same upload panel described in step 4 below.
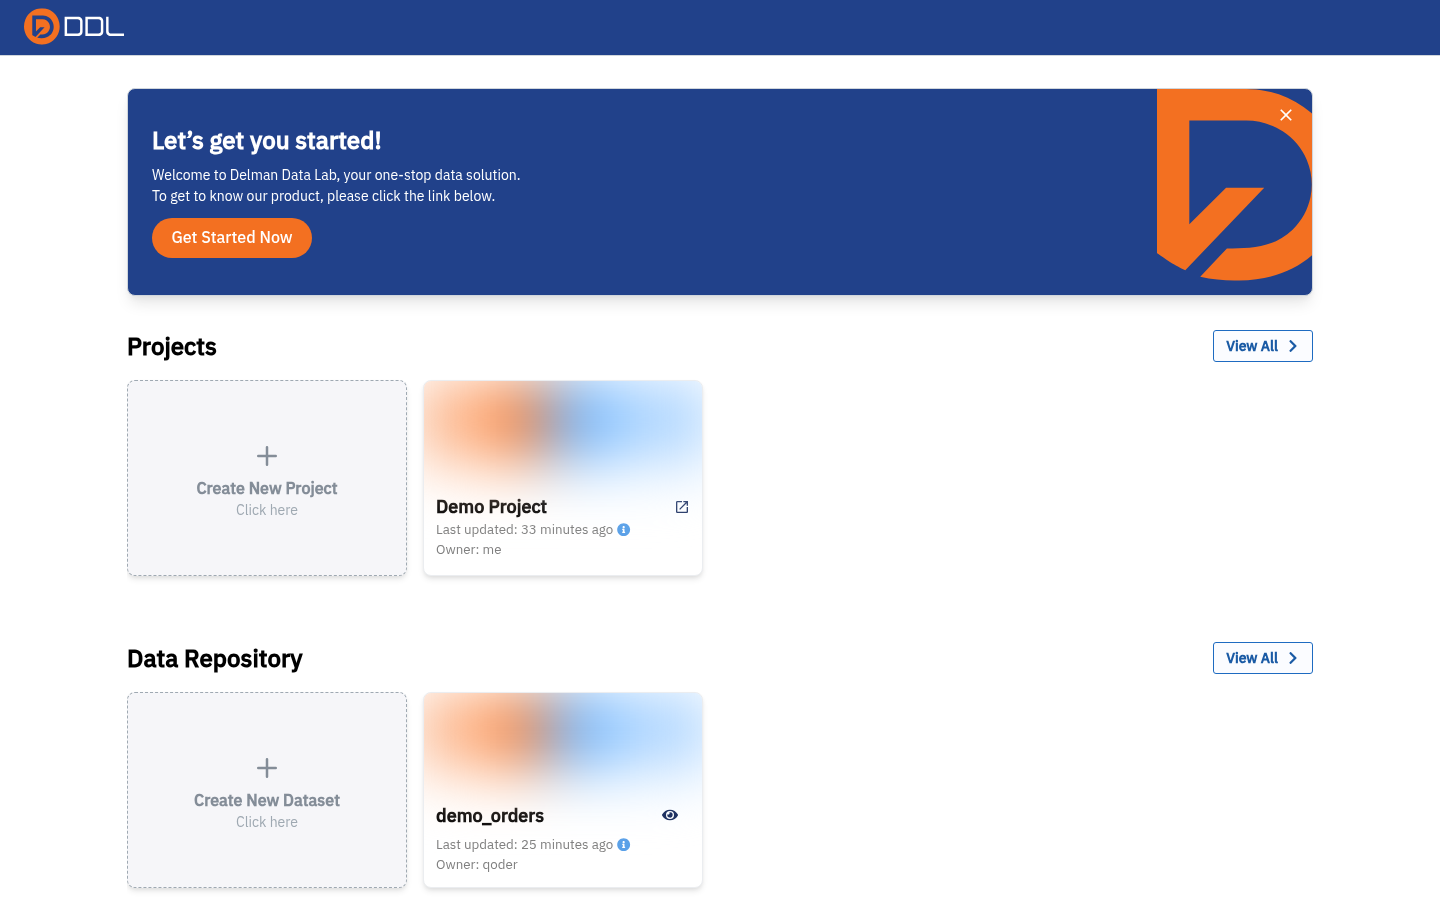 With the banner shown: welcome copy and the Get Started Now link.
Get Started Now opens the external documentation site https://guide.delman.io in a new tab — it does not open an in-app dialog, so the dashboard behind it stays unchanged.
 The dashboard is still there: the link left the app rather than opening a panel inside it.
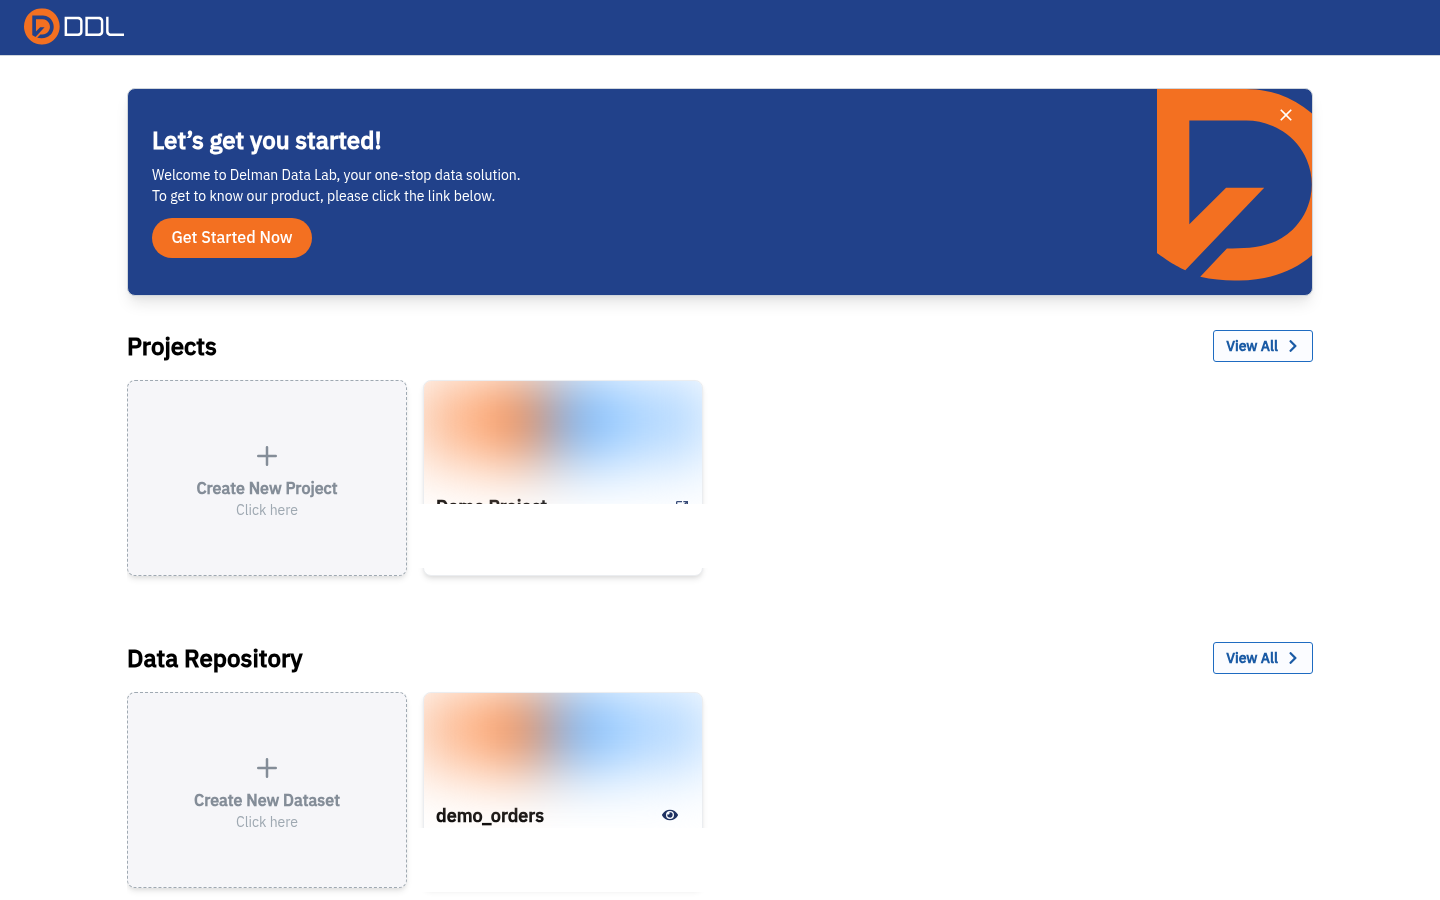 The same page once a project and a dataset exist: a Demo Project card with "Last updated" and "Owner", and a demo_orders dataset card with an eye icon that opens its details.
The profile menu
Click your name in the navbar to open the account menu.
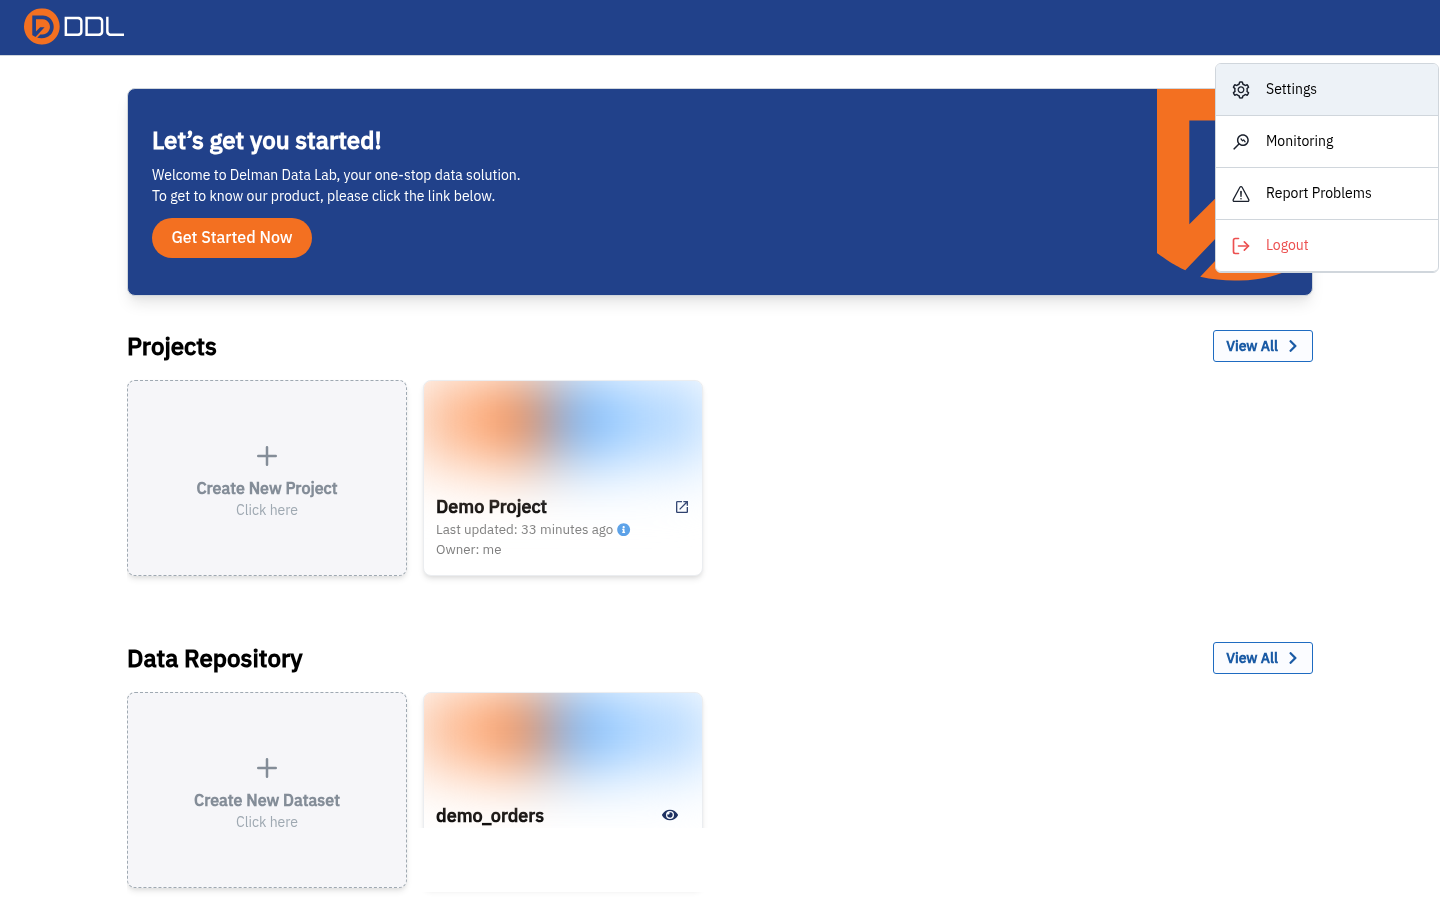 The profile menu: Settings, Monitoring, Report Problems and Logout.
| Item | Where it takes you |
|---|---|
| Settings | /settings/ai-integration — the AI settings page, from which the whole Settings area is reachable |
| Monitoring | /monitoring — every process run you can see |
| Report Problems | Opens your mail client addressed to [email redacted] with a pre-filled subject |
| Logout | Ends the session |
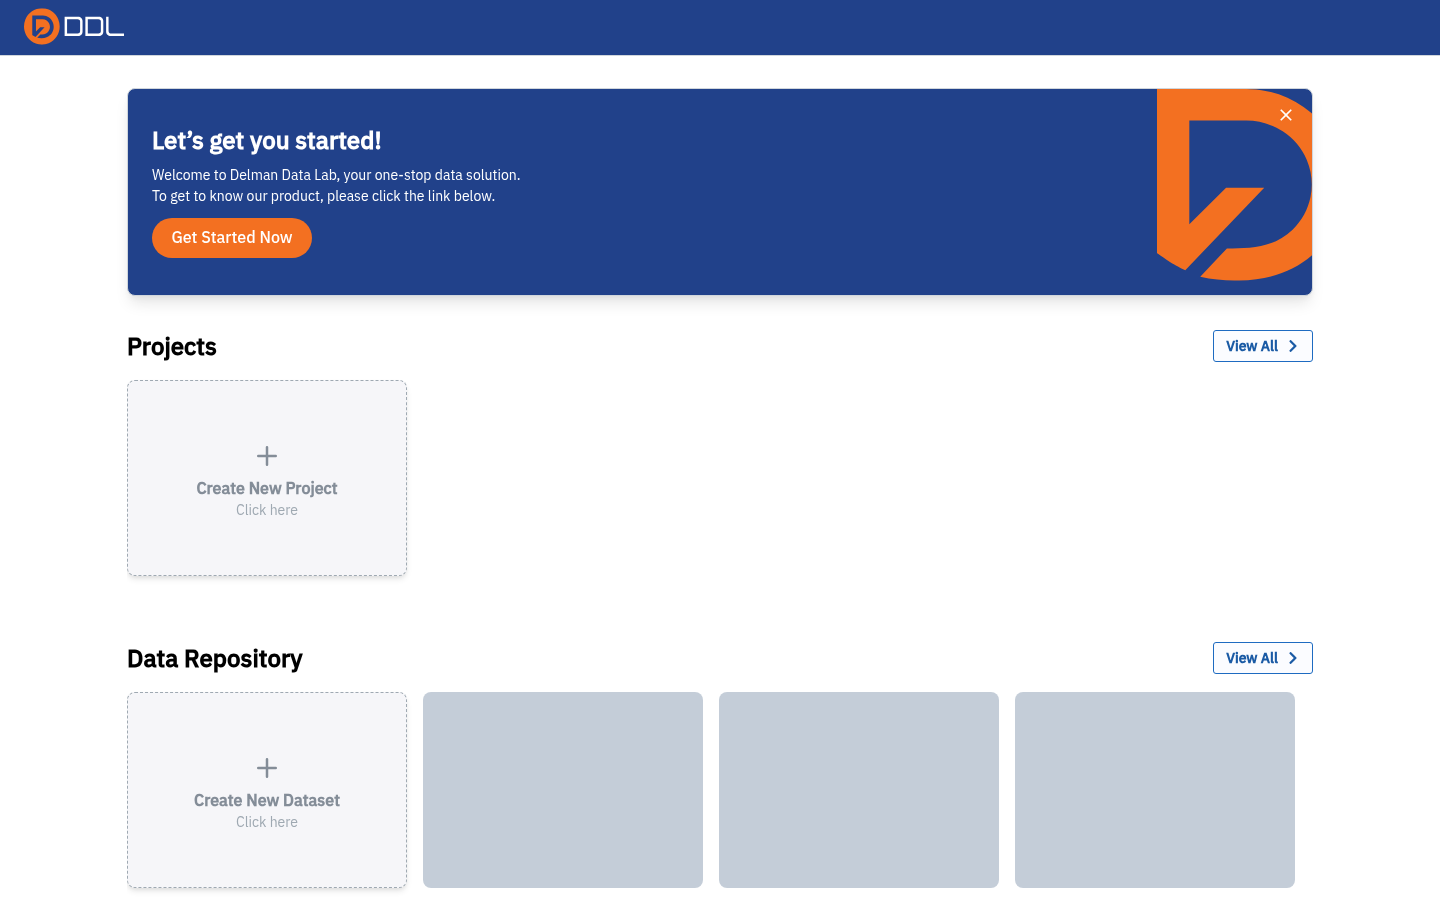 The same dropdown on a page where the Data Repository is still empty — note the skeleton placeholders where dataset cards will appear.
The meters lag
Storage and Processing in the navbar show your live usage and often read 0B used / 0 Mins used even when Settings → Storage Usage reports tens of megabytes for the instance. Sub-second SQL runs round down to 0 too. Treat the meters as indicative, not as a bill. See the FAQ.
3. Create your first project
A project is the container for everything you build: connections, pipeline, SQL, schedules, monitoring, charts and dashboards.
There is no "create project" dialog
Create New does not ask you for a name. It creates a project instantly with an auto-generated name (Project 1, Project 2, …) and drops you straight inside it. Plan to rename it in step 3.4.
- Go to
/projects(or click View All in the Projects section of the home dashboard). - Click Create New.
 One click later you are inside the new project's Pipeline canvas — no dialog appeared first.
- Back on
/projects, confirm the new row exists (Project 1 · me · less than a minute ago).
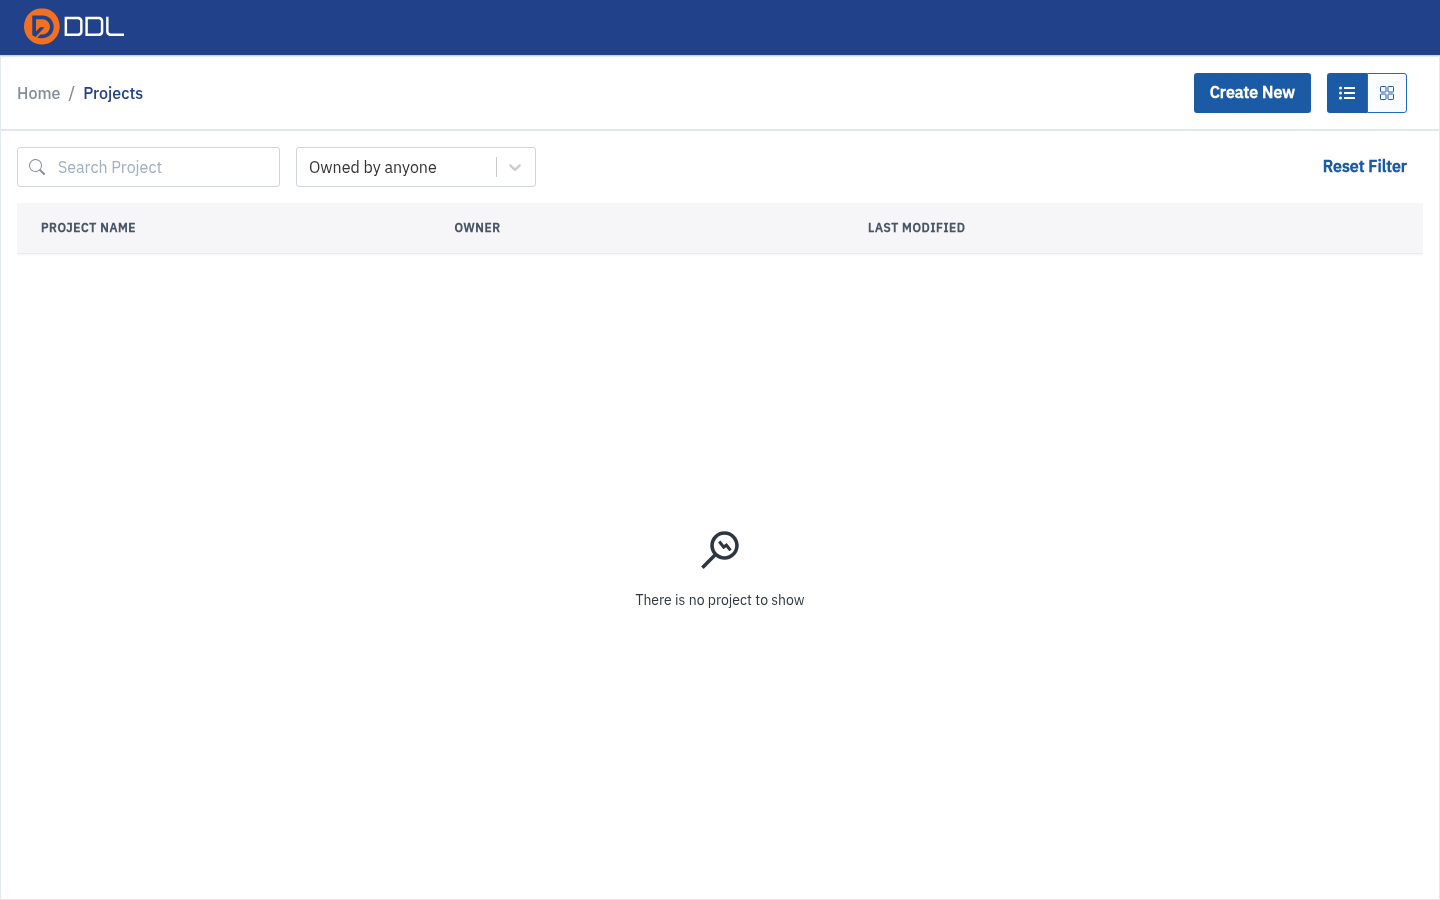 The projects list: search box, owner filter, table/grid switch and the Create New button.
- Rename it. In the project's left rail choose Project Settings → Change Project Name, clear the field, type a real name, and Save.
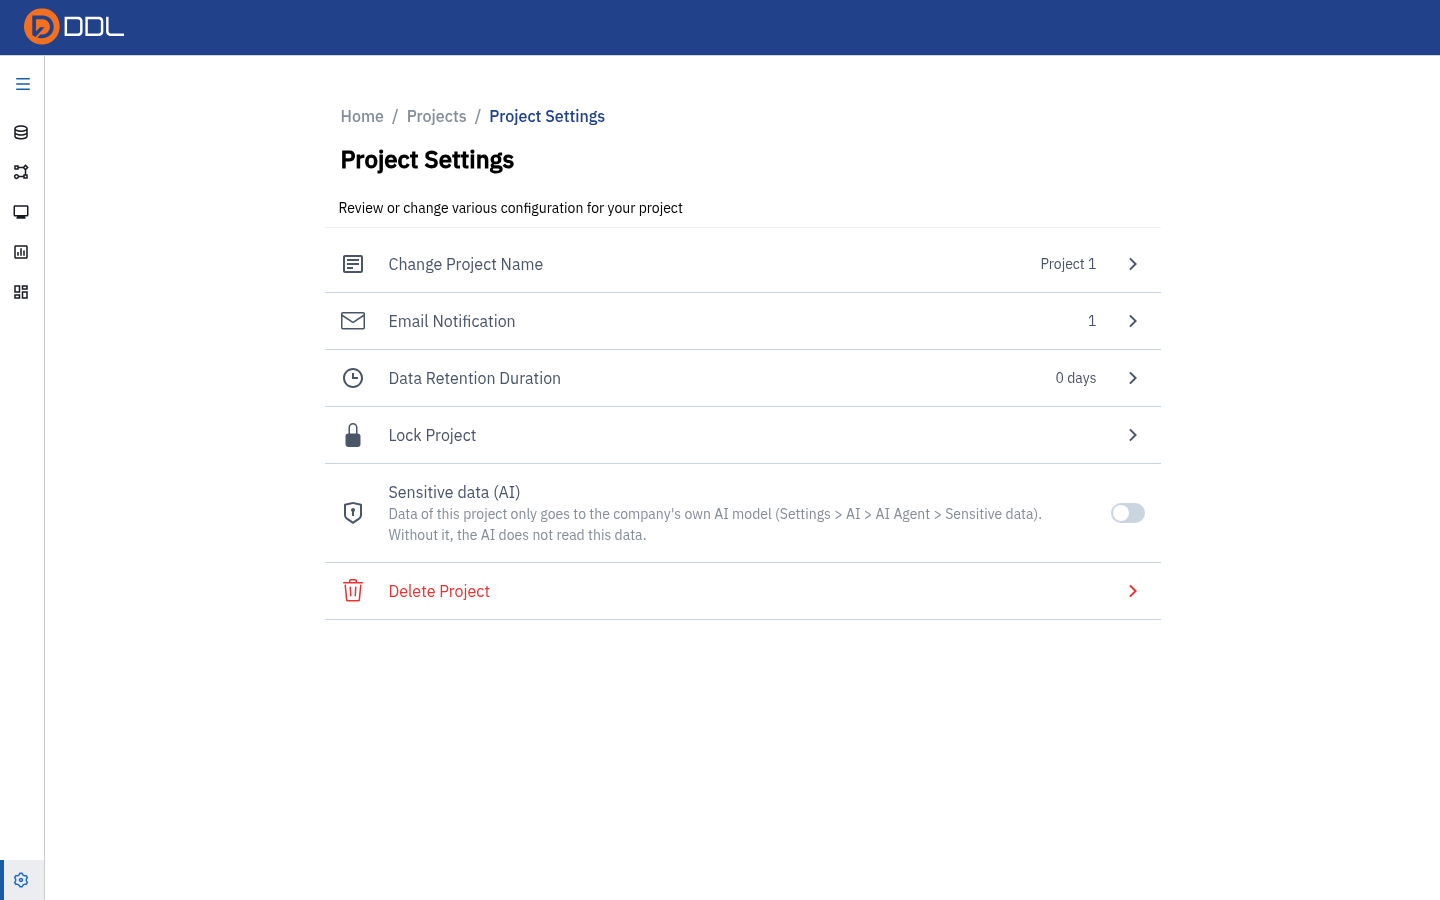 Project Settings holds Change Project Name, Email Notification, Data Retention Duration, Lock Project, Sensitive data (AI) and Delete Project.
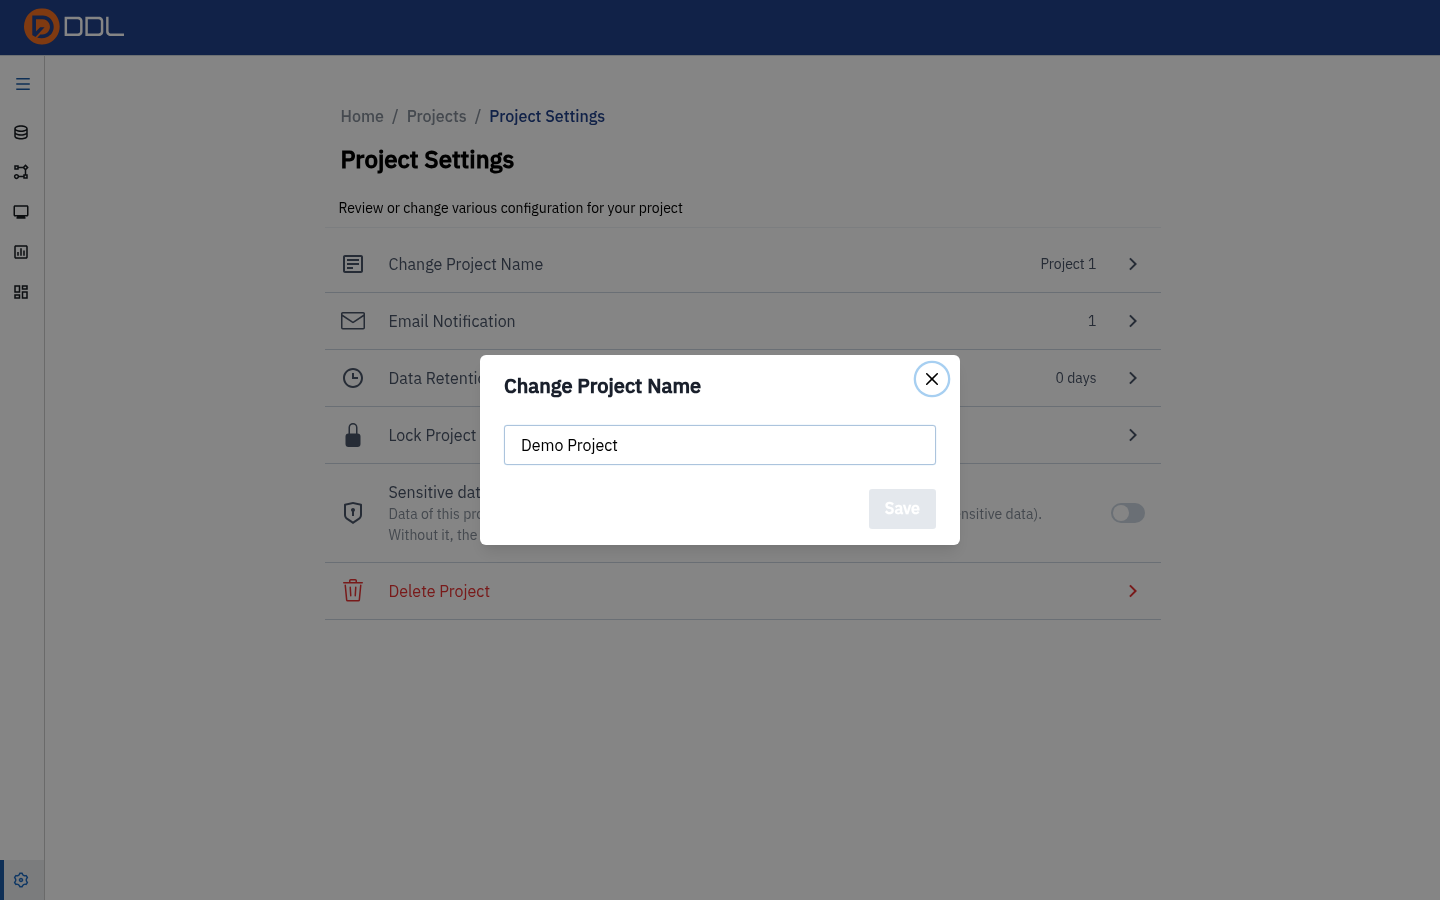 The Change Project Name modal with the new name typed in.
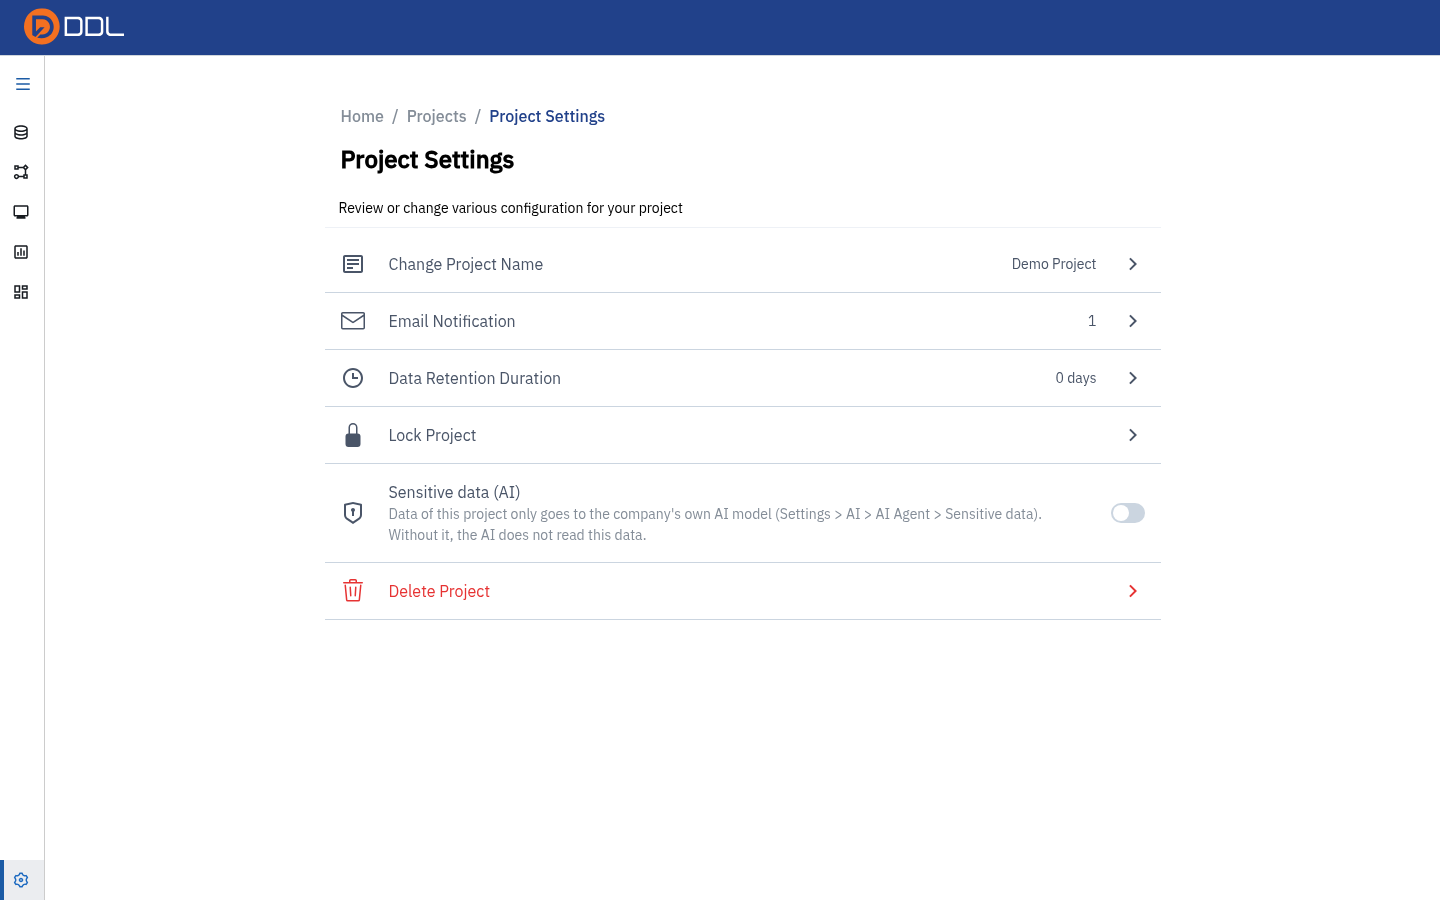 After Save , the header and breadcrumb show the new name.
You now have a project. Projects covers sharing, versions and the rest of the sidebar.
4. Upload a CSV to the Data Repository
The Data Repository is the account-wide landing zone for raw files. A dataset uploaded here can be imported into any project you can access.
- Go to
/data-repositoryand click Upload File Data. A panel slides in from the right (it is a side panel, not a modal — the URL gains?create_new=true).
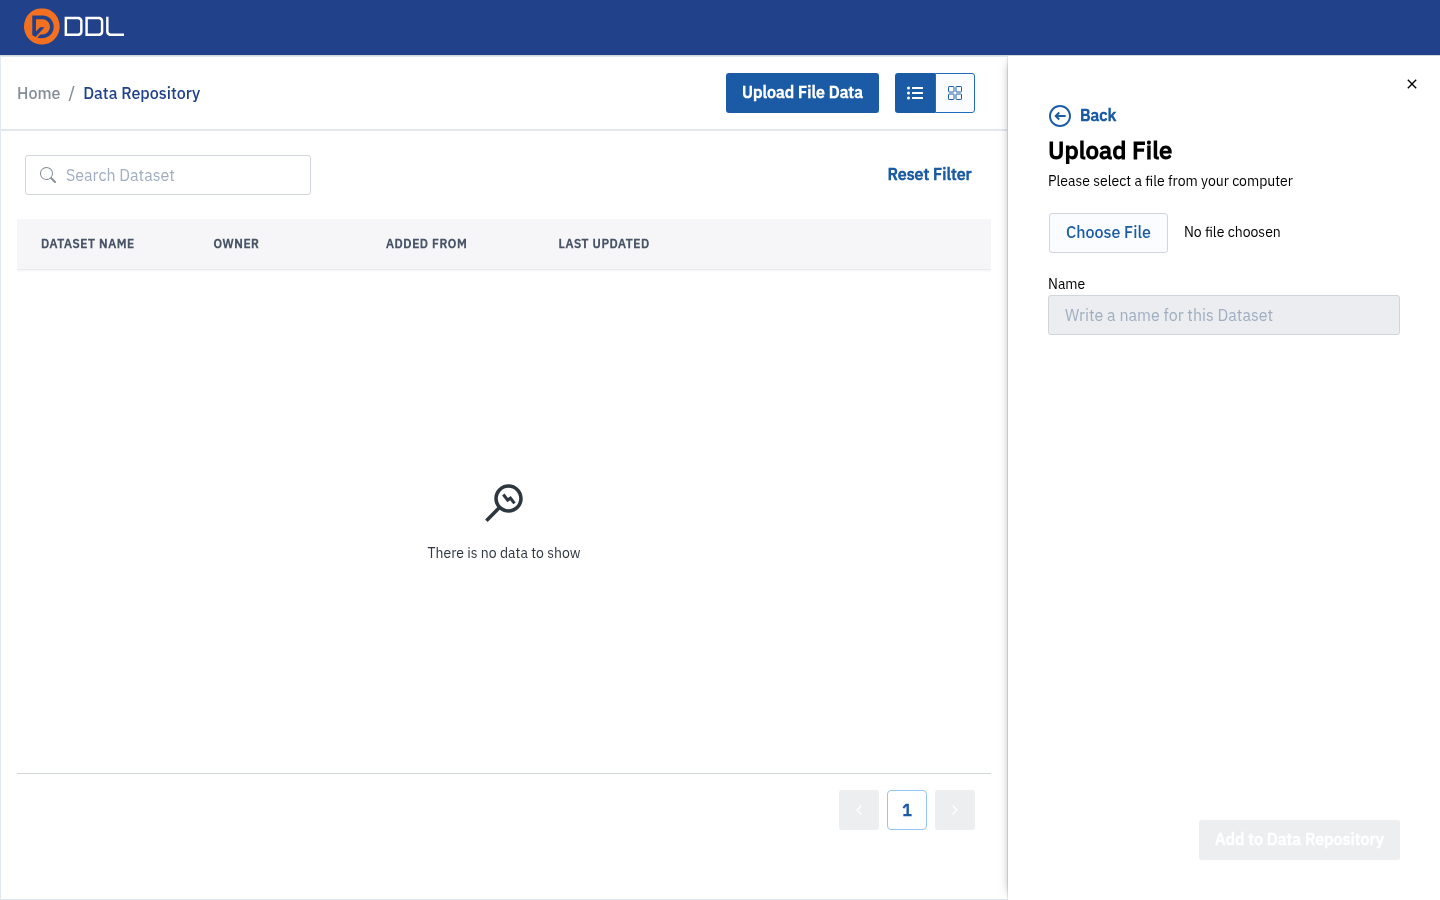 Upload File: choose a file, give the dataset a name, then Add to Data Repository to finish.
- Click Choose File and select your file. Accepted types:
.csv,.xlsx,.xls, JSON and.parquet. The Name field is prefilled from the file name.
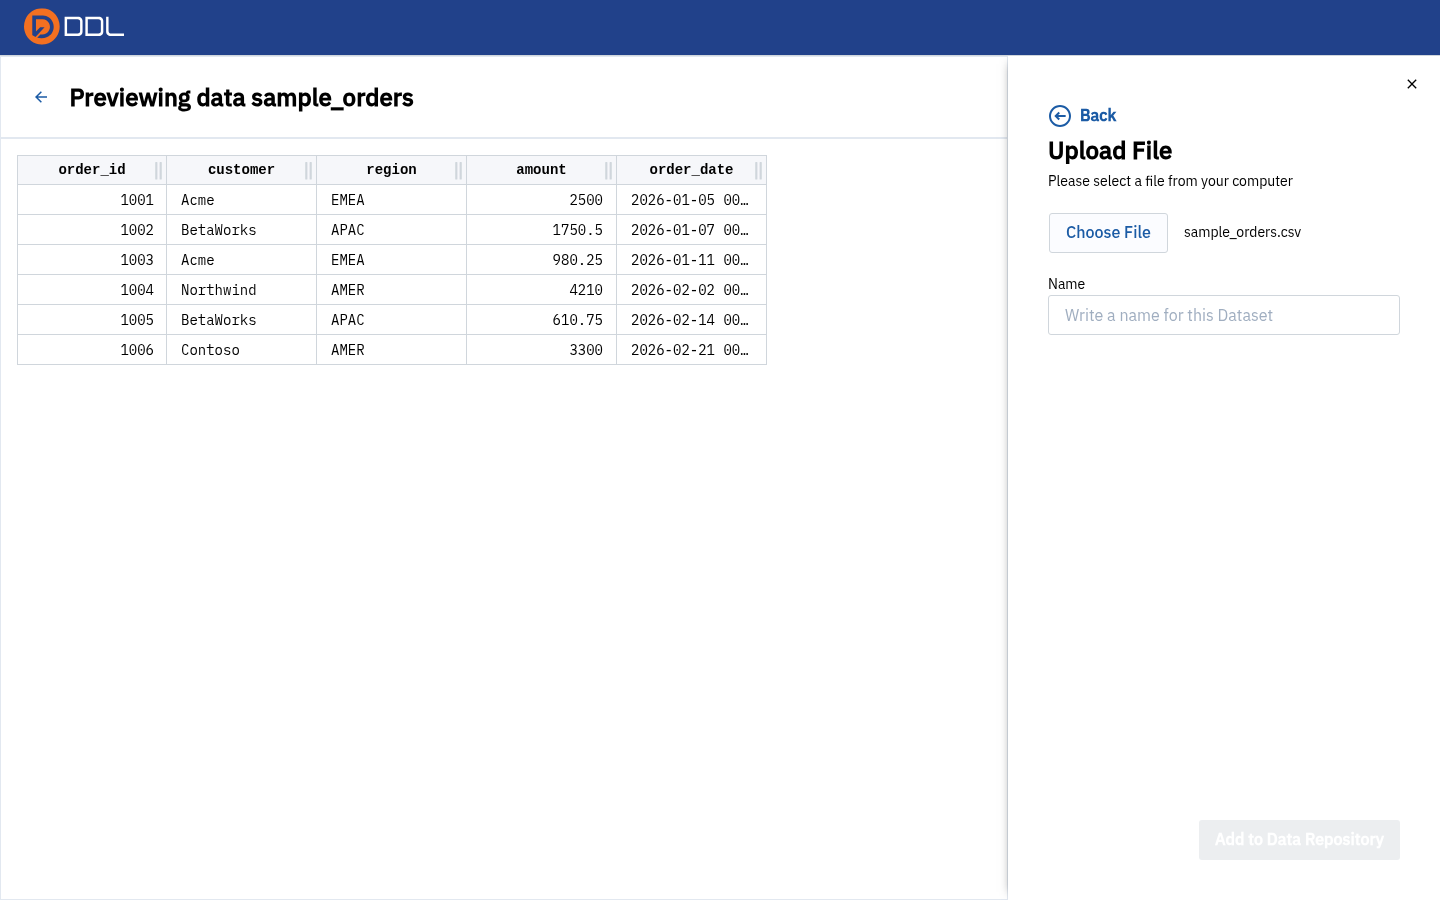 The selected file with the auto-filled dataset name.
- Replace the name with something your team will recognise, then click Add to Data Repository.
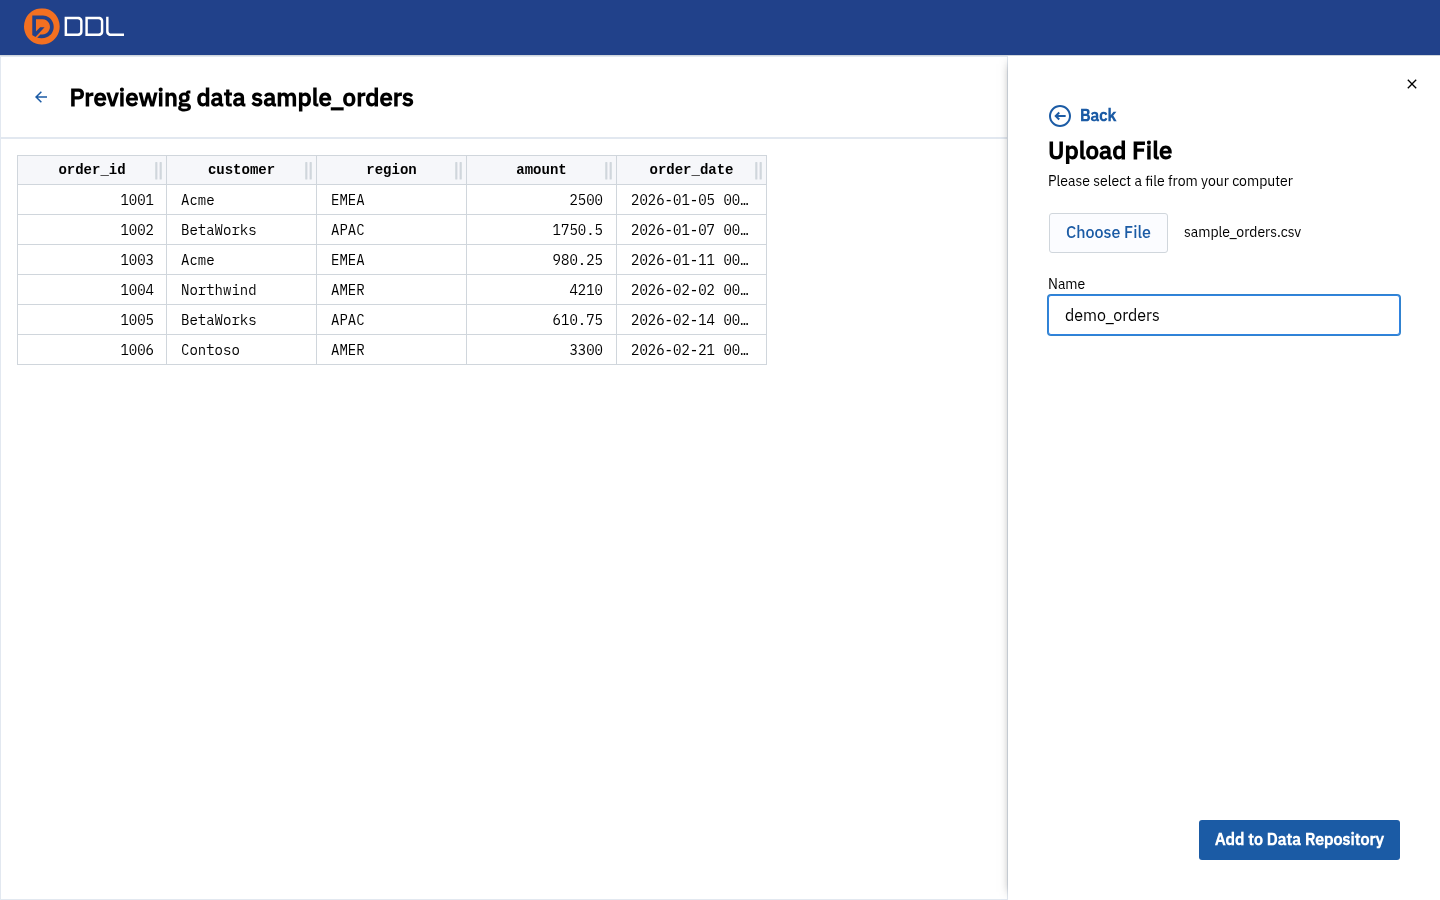 Renaming to demo_orders before committing the upload.
- The panel closes and your dataset appears in the list.
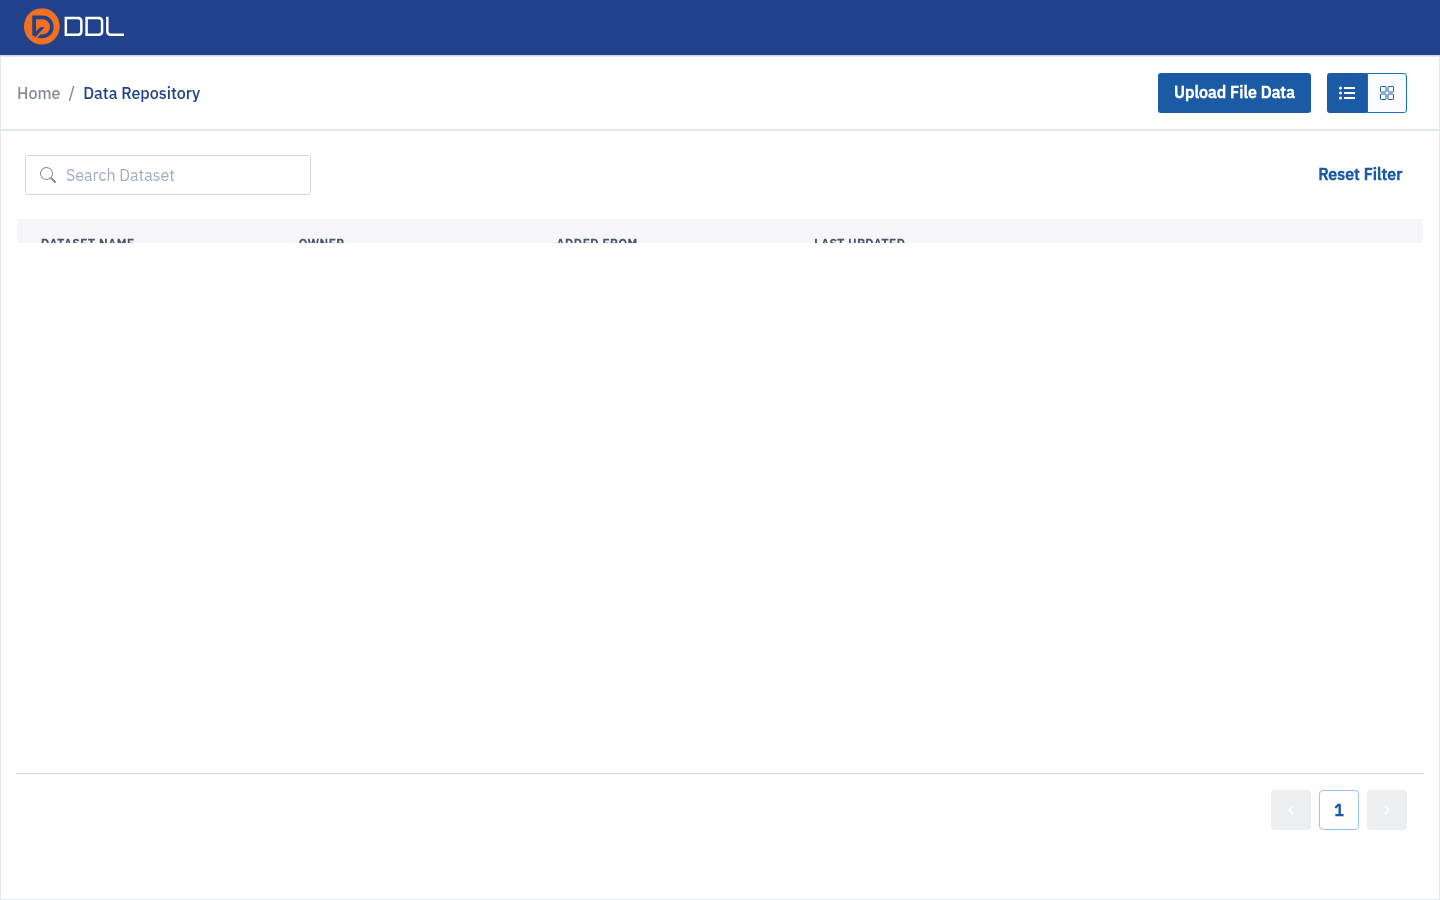 One row: dataset name, owner, ADDED FROM = File Upload, last updated, and See Details to preview the data.
Full details, including the grid layout and the preview page, are in Data Repository.
5. Import the dataset into your pipeline
A dataset sitting in the repository is not yet part of your project. Import it as a source node.
- Open your project and make sure you are on the Pipeline tab (the bare project URL is the canvas). Click Add data.
- In the Select Connection Type panel choose the Data Repository (Internal) tab.
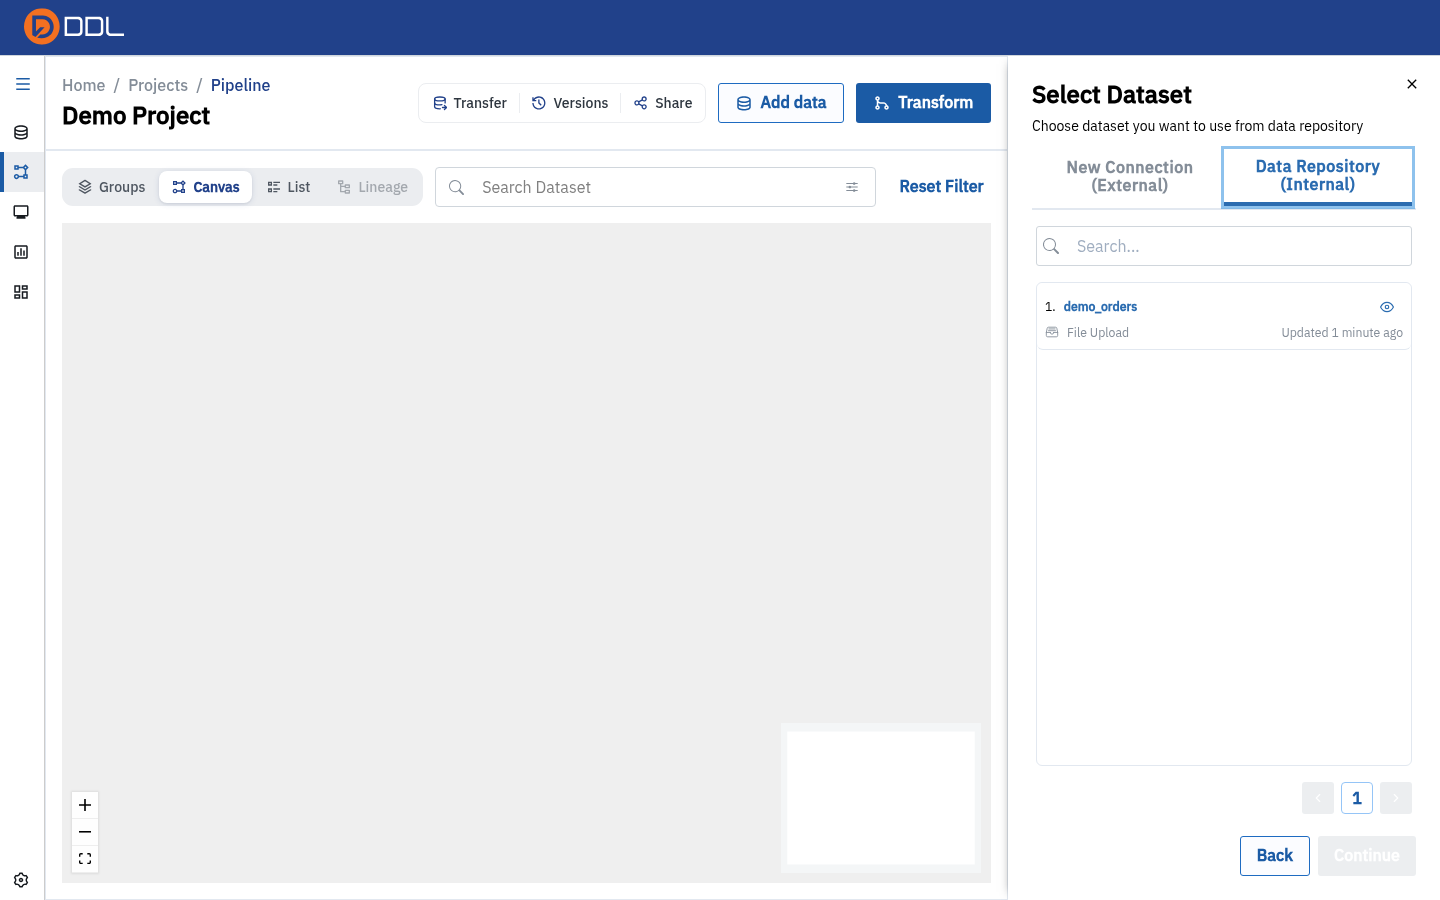 The internal tab lists the datasets in the Data Repository — here only demo_orders exists.
- Select the dataset card and click Continue.
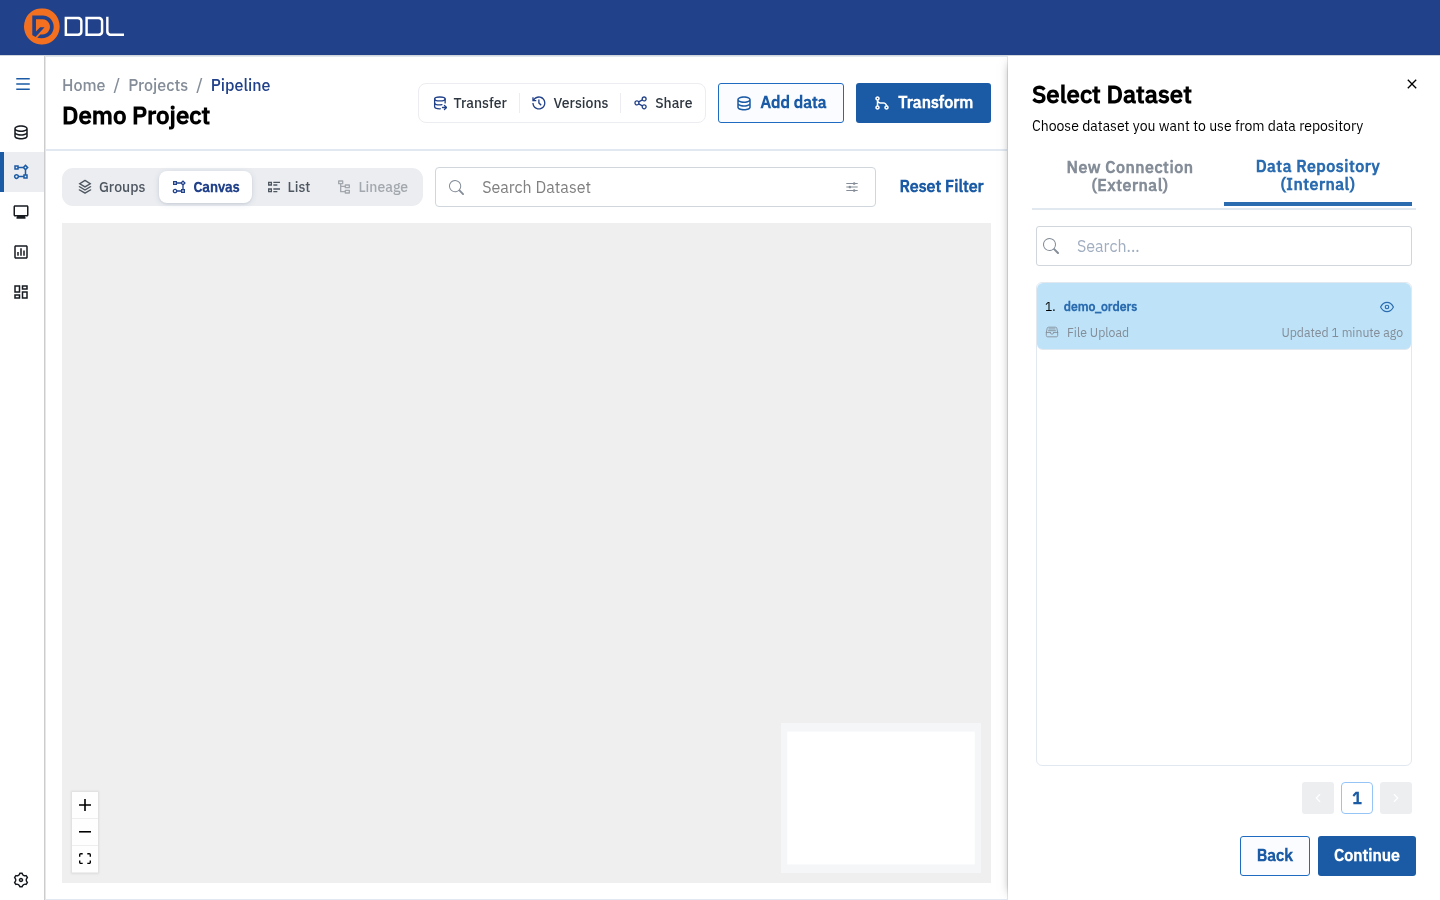 The chosen dataset card.
- On Import this dataset, keep (or edit) the Save As name, decide whether to tick Auto Sync from dataset source, and click Import Dataset.
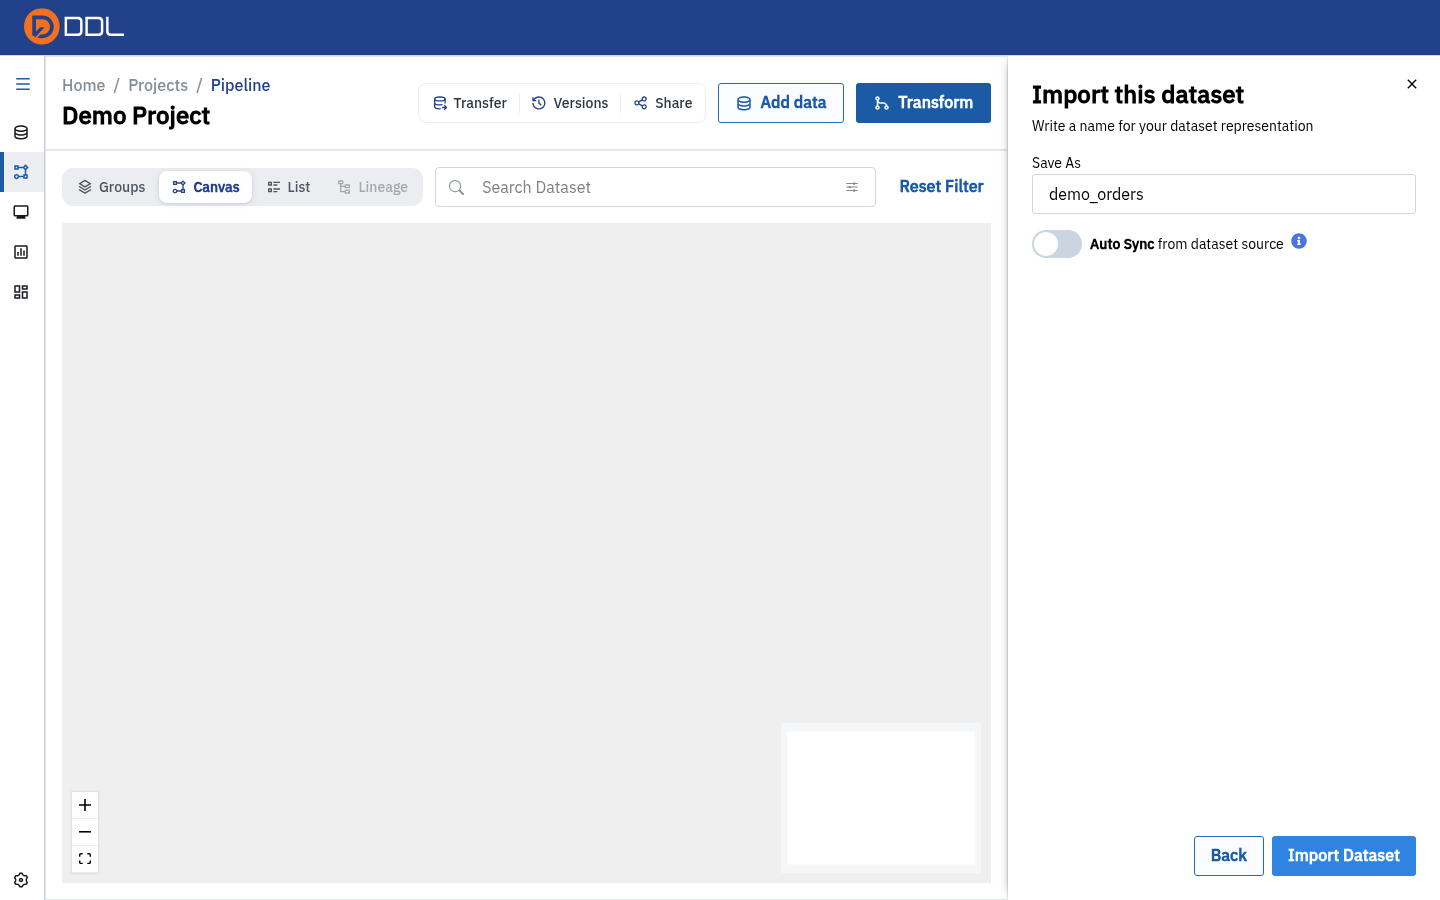 Name the node representation and confirm with Import Dataset .
- The canvas now shows one node.
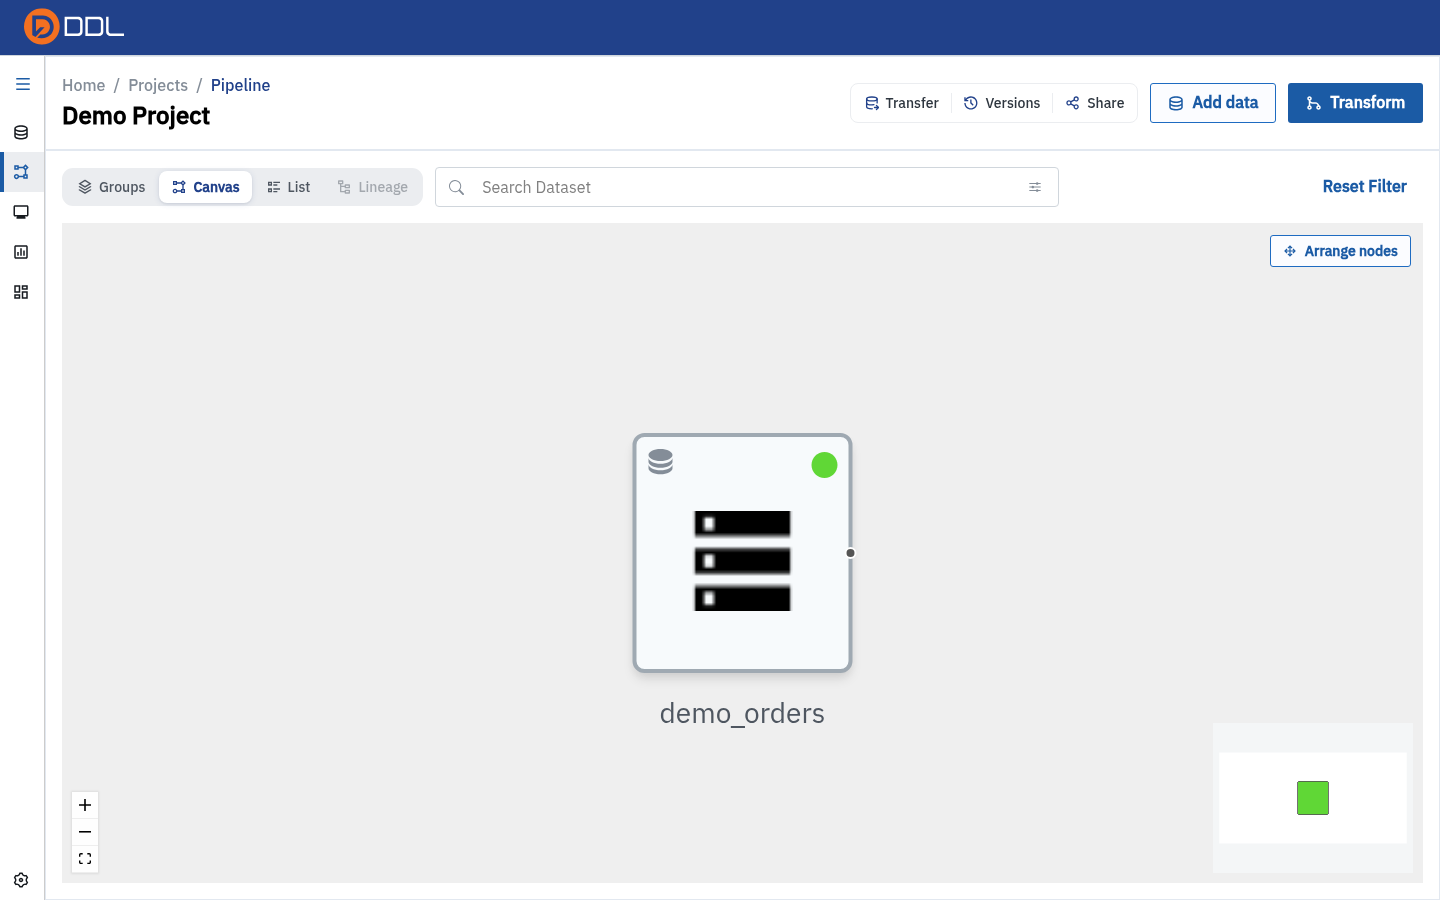 The demo_orders source node on the canvas, with its status icon.
Next: Pipelines (ETL) — transforms, syncs, and the List / Lineage / Groups views.
6. Run your first SQL query
- In the project's left rail click SQL Query.
- In the left Nodes panel, expand your node, click its ⋮ menu and choose View Data.
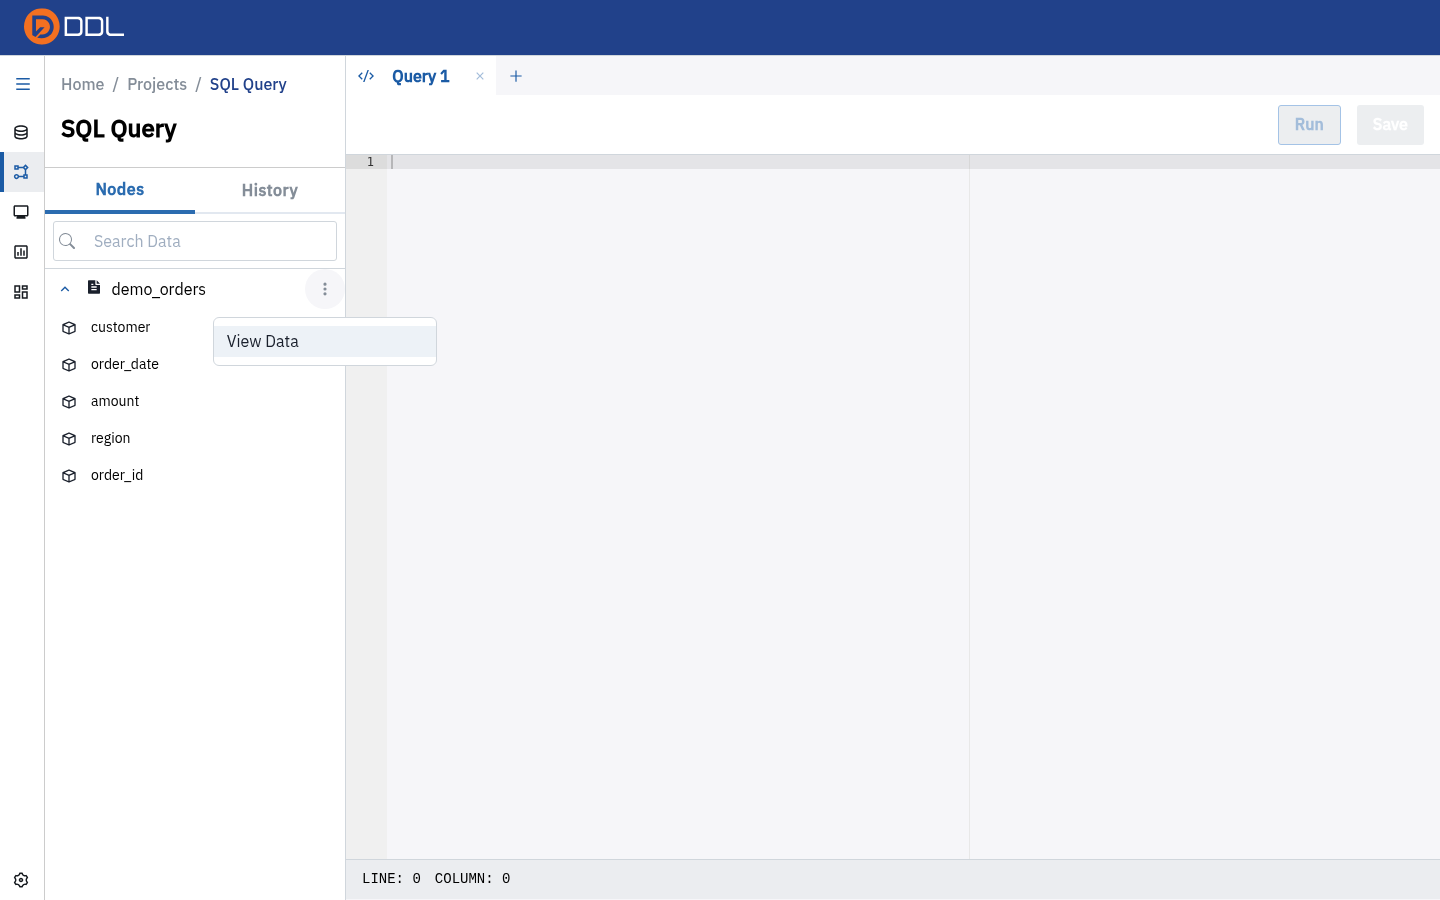 View Data writes a correct query for you — the safest way to get the table name right.
- DDL opens a new query tab containing a ready-made statement and runs it.
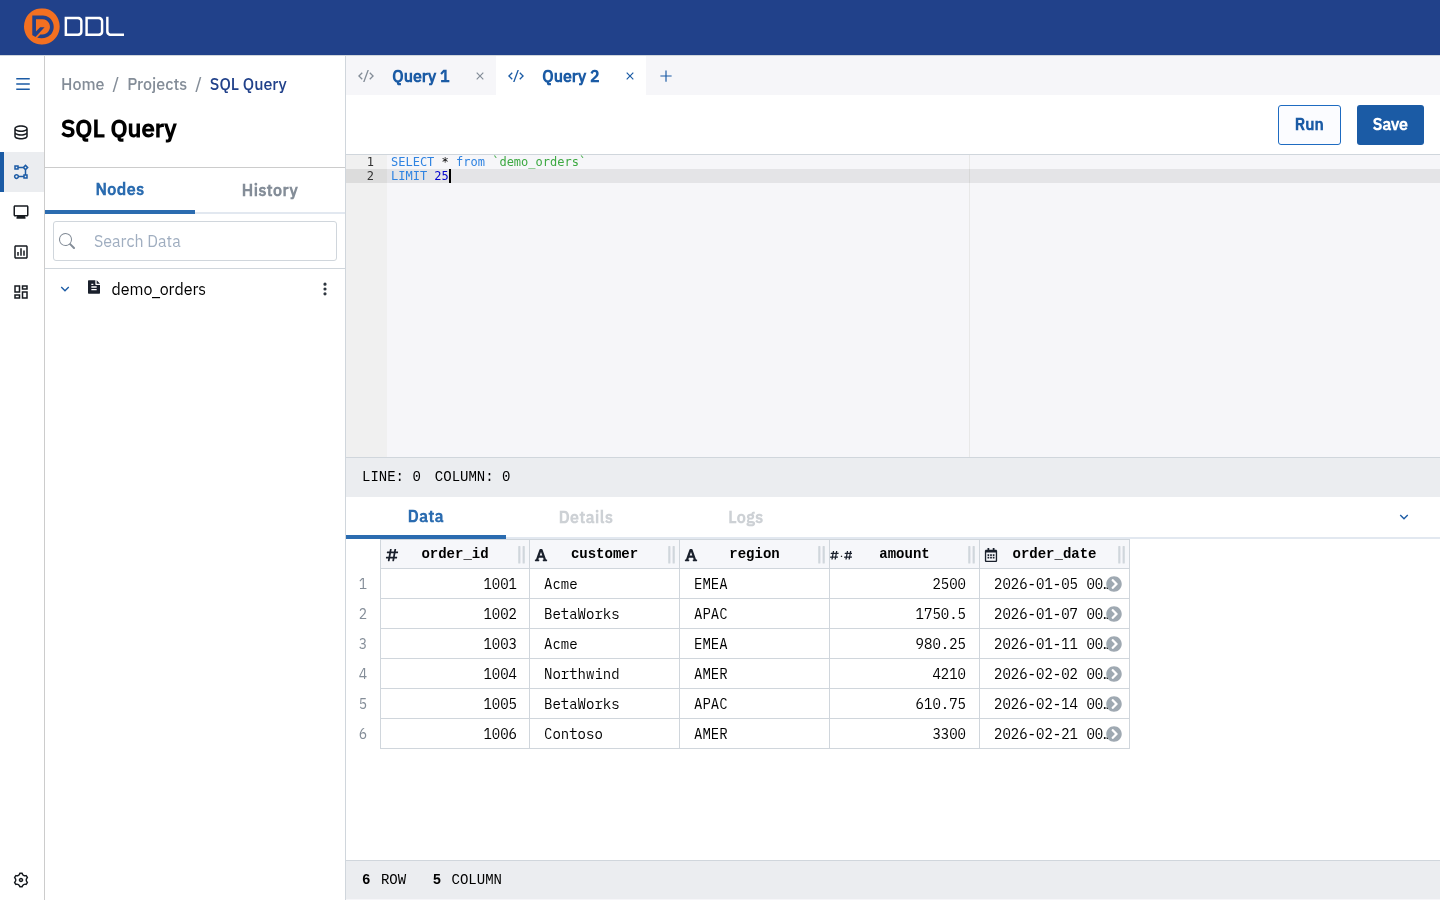 The generated statement
SELECT * from `demo_orders` LIMIT 25 in a new tab.
- Read the result in the Data tab.
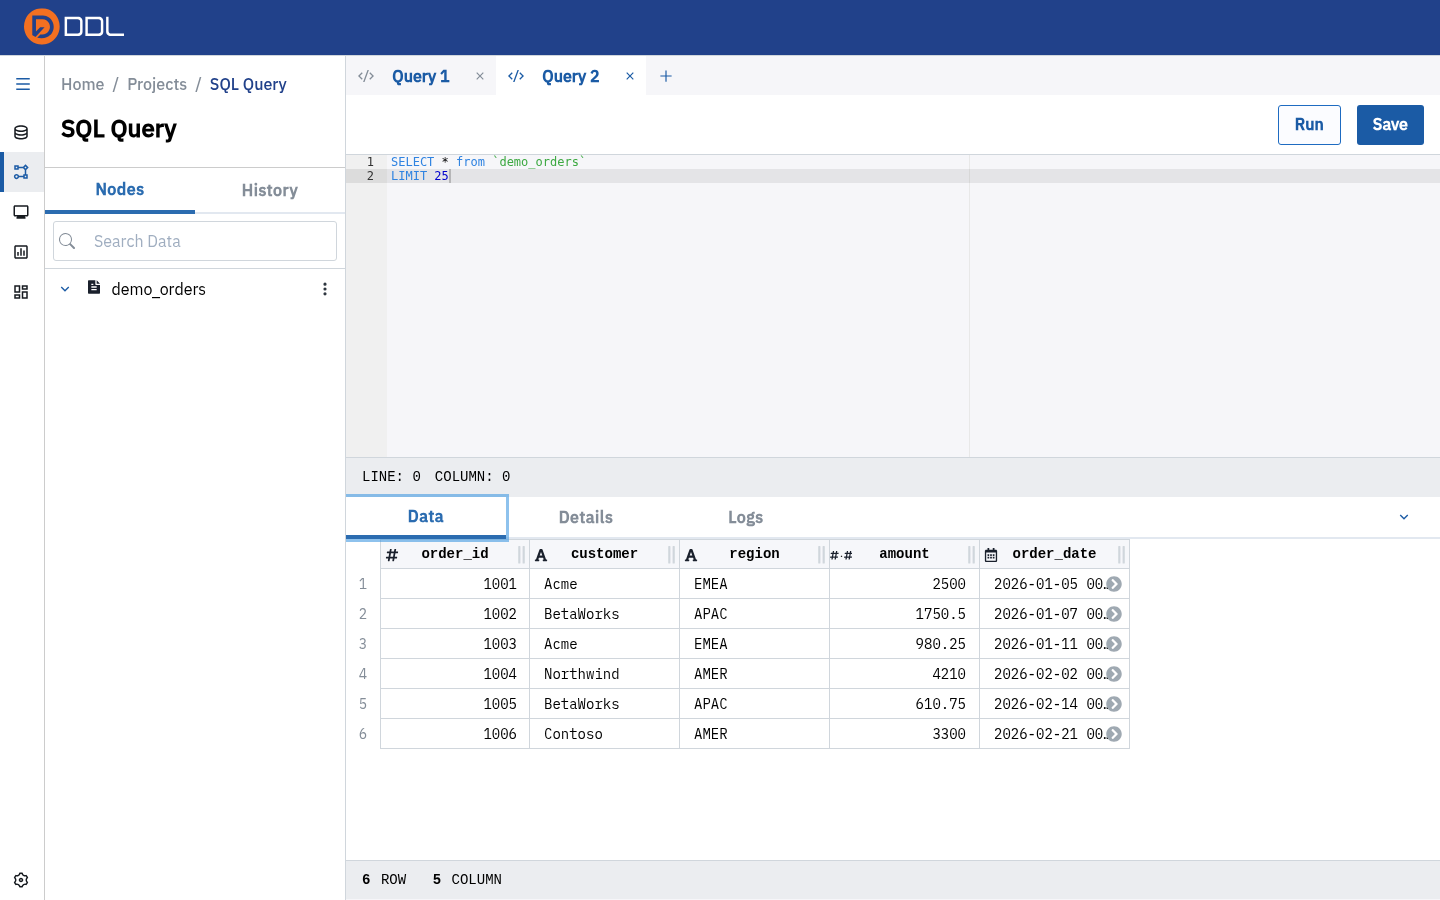 6 ROW / 5 COLUMN — your uploaded file, queryable.
The one rule that trips everybody up
In SQL, a table is addressed only as the node name wrapped in backticks: FROM `demo_orders` . Plain names, "double quotes" and schema.table all fail with relation "…" does not exist. Full explanation and worked examples: SQL Query.
7. Check that it ran
Open Monitoring (project tab, or /monitoring for everything you can see). Your SQL run appears as a SQL Query process with a status, a start time and a duration; View Log opens the technical log. See Monitoring.
Where to go next
| You want to… | Read |
|---|---|
| Bring in a database or spreadsheet | Connections |
| Join, append or match datasets | Pipelines (ETL) |
| Write real SQL and save it as a node | SQL Query |
| Keep a dataset fresh automatically | Schedules |
| Let an AI assistant query DDL for you | AI & MCP integration |
| Understand a number that looks wrong | FAQ & troubleshooting |