
Pipelines (ETL)
Purpose: the Pipeline page is where a project's data work happens — a canvas (/projects/<id>, the bare project URL) on which every dataset that feeds or is produced by the project appears as a node. Bring data in, transform it, move it out, run it, and inspect what happened.
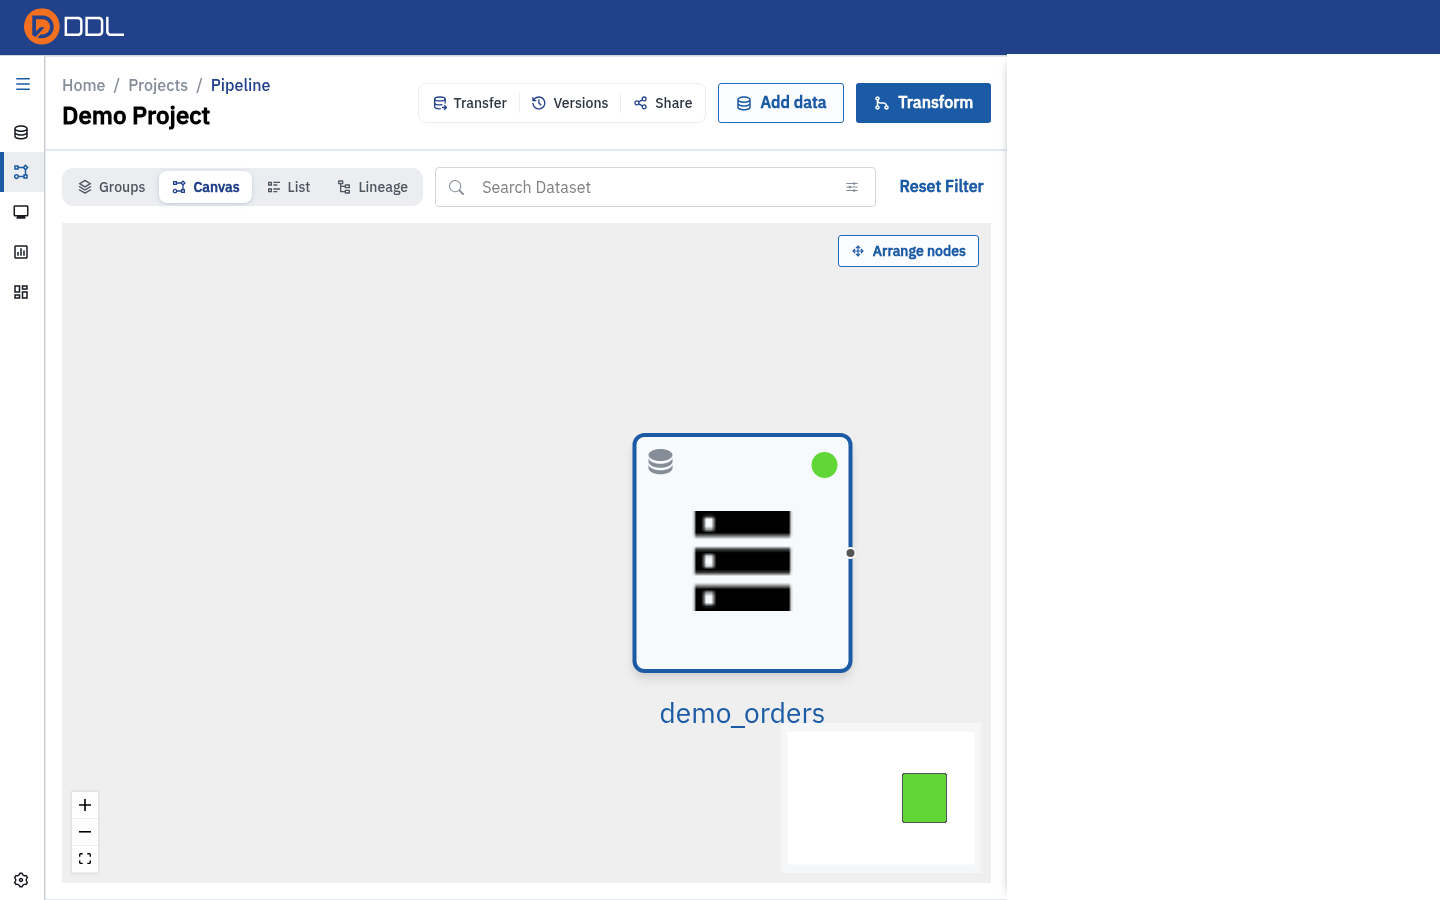
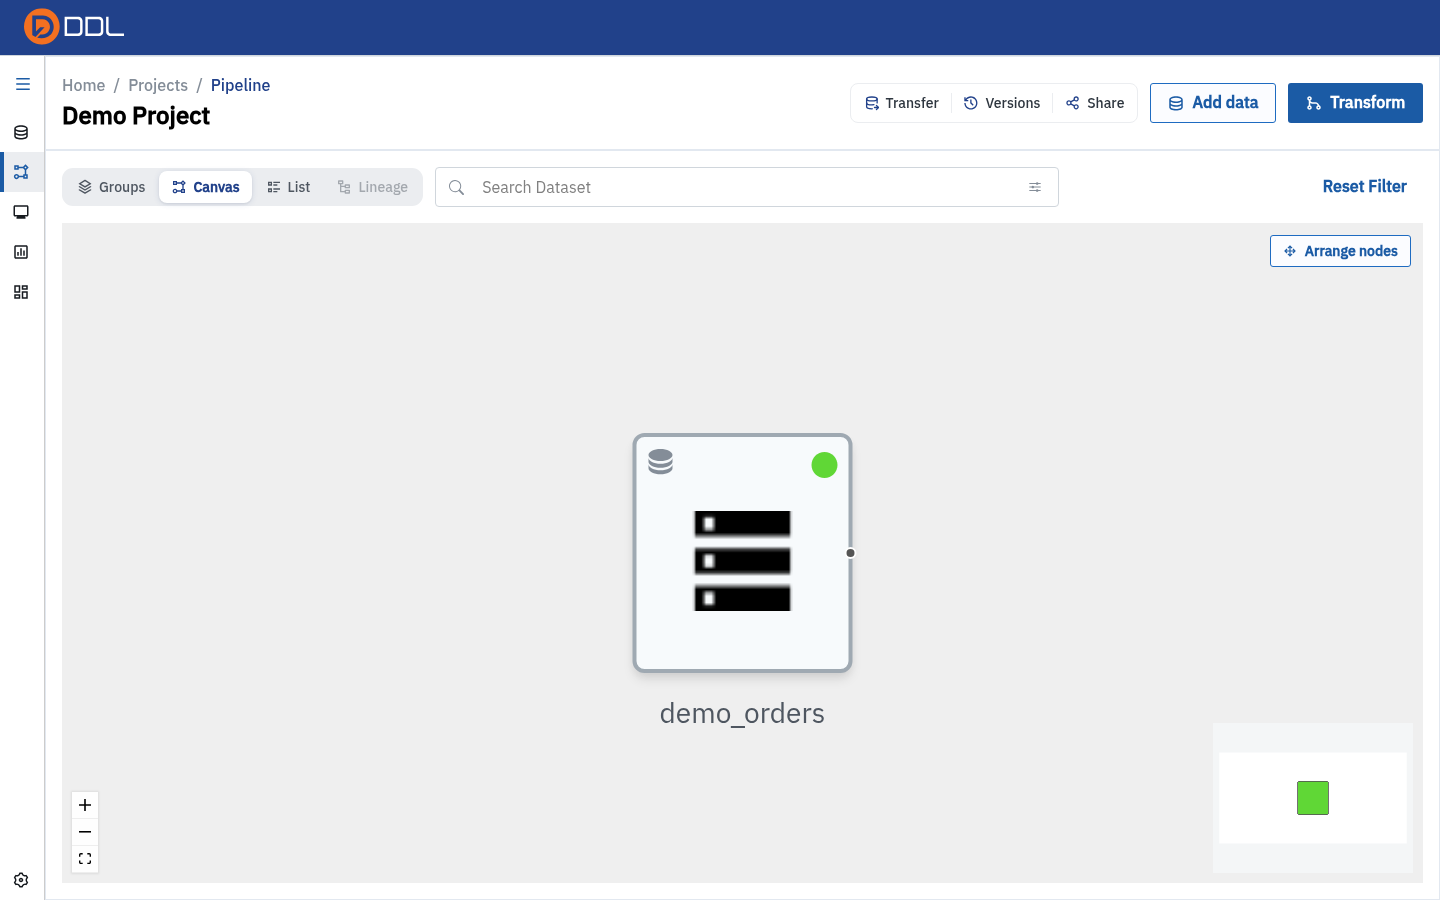 A canvas with one node: the demo_orders source imported from the Data Repository.
The toolbar
| Button | What it does |
|---|---|
| Add data | Opens the right-hand side panel that creates a new source node |
| Transform | Opens the Transform Data modal (Merge / Union / Identity Matching / Use Script / SQL Query) |
| Transfer | Pushes node output to an export connection |
| Versions | Opens the project's version history |
| Share | Project sharing modal — see Projects |
| Groups / Canvas / List / Lineage | View switcher — see below |
| Search Dataset | Filter the canvas down to one dataset (Ctrl+K focuses this control) |
| Reset Filter | Clear the dataset filter |
| Arrange nodes | Auto-layout the DAG |
Ctrl+K is not a command palette
It focuses the Search Dataset select and nothing else. There is no global command palette in DDL, so learn the direct URLs (/projects/<id>, /projects/<id>/sql-query, /monitoring) if you navigate by keyboard.
Add data: bring something in
Add data opens a Select Connection Type panel with two tabs.
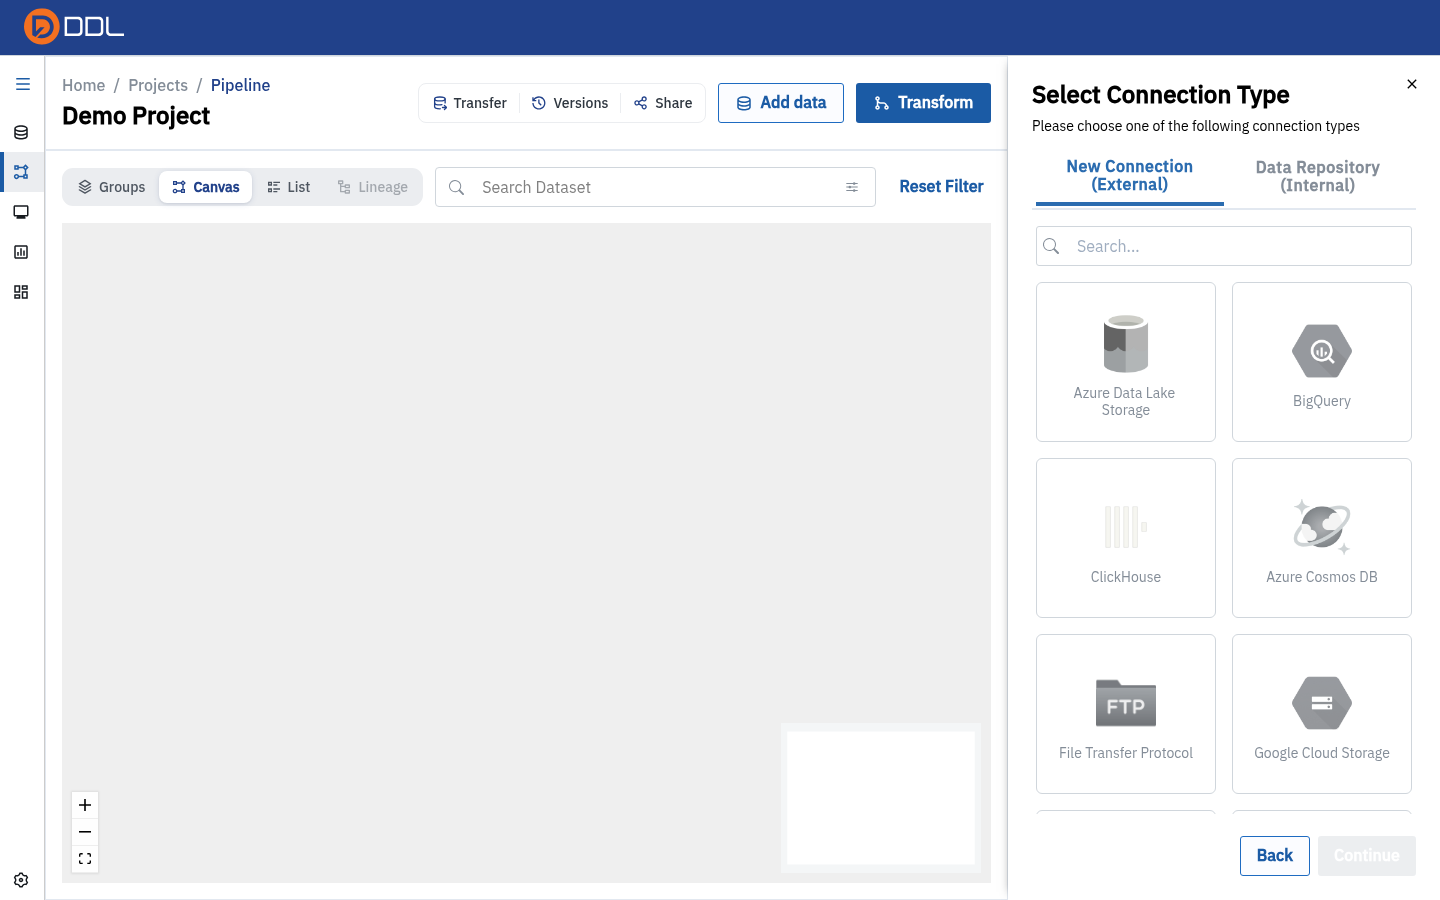 Left: New Connection (External) — 18 connector cards plus Upload File. Right: Data Repository (Internal) — your existing datasets.
From an external system (New Connection (External))
Pick a connector and complete its form. That is the same flow as Connections → Create a connection; the connection is saved to the project and becomes a source node.
From the Data Repository (Data Repository (Internal))
- Click the Data Repository (Internal) tab — the panel becomes Select Dataset ("Choose dataset you want to use from data repository") with a paged card list.
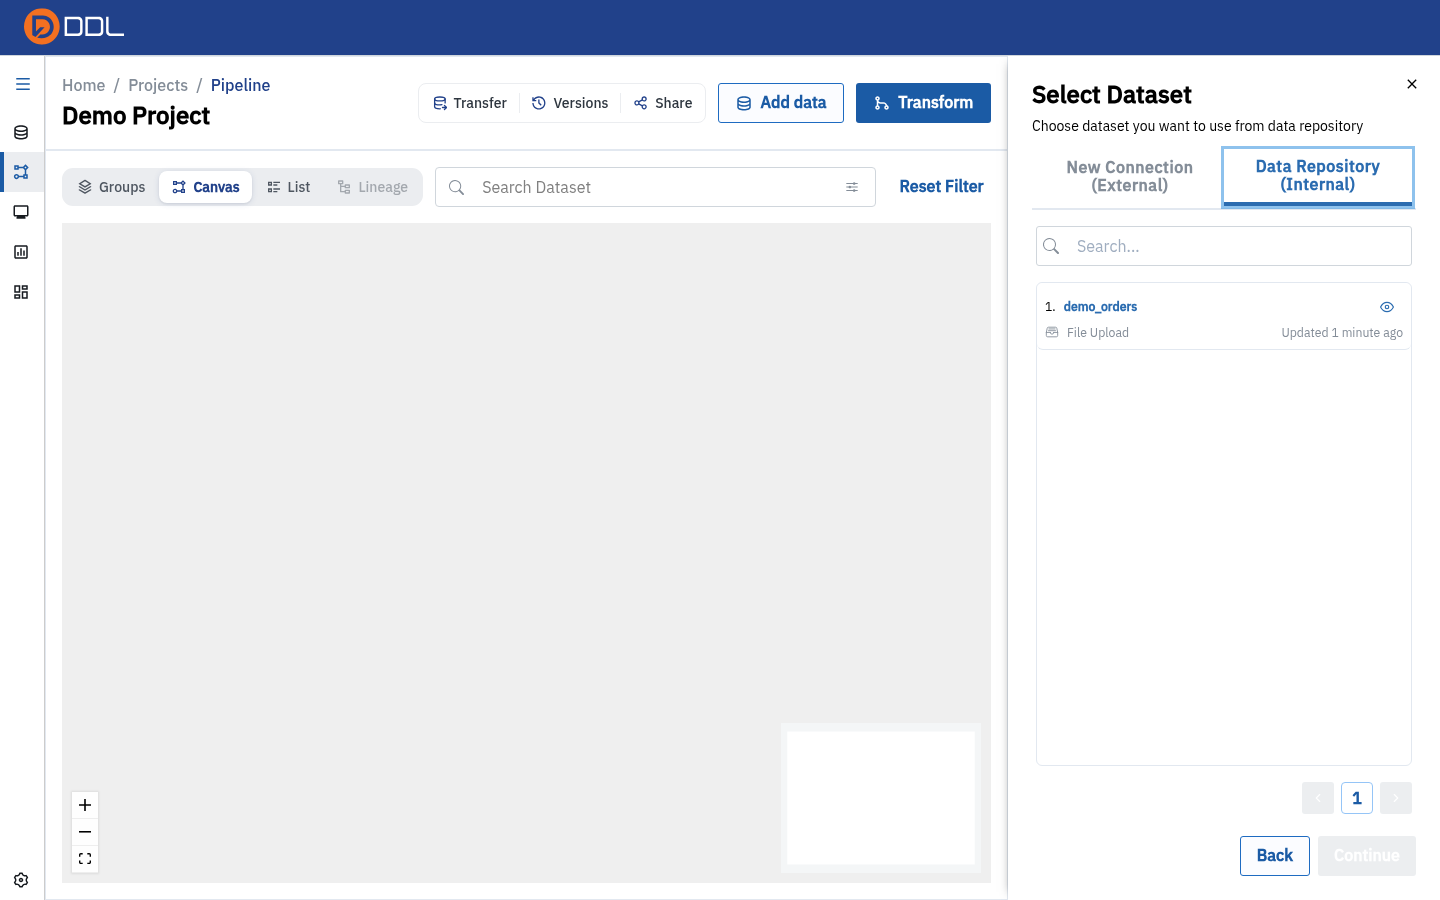 Every dataset in the account-wide repository, each card showing its source type and how recently it was updated.
- Select a card and click Continue.
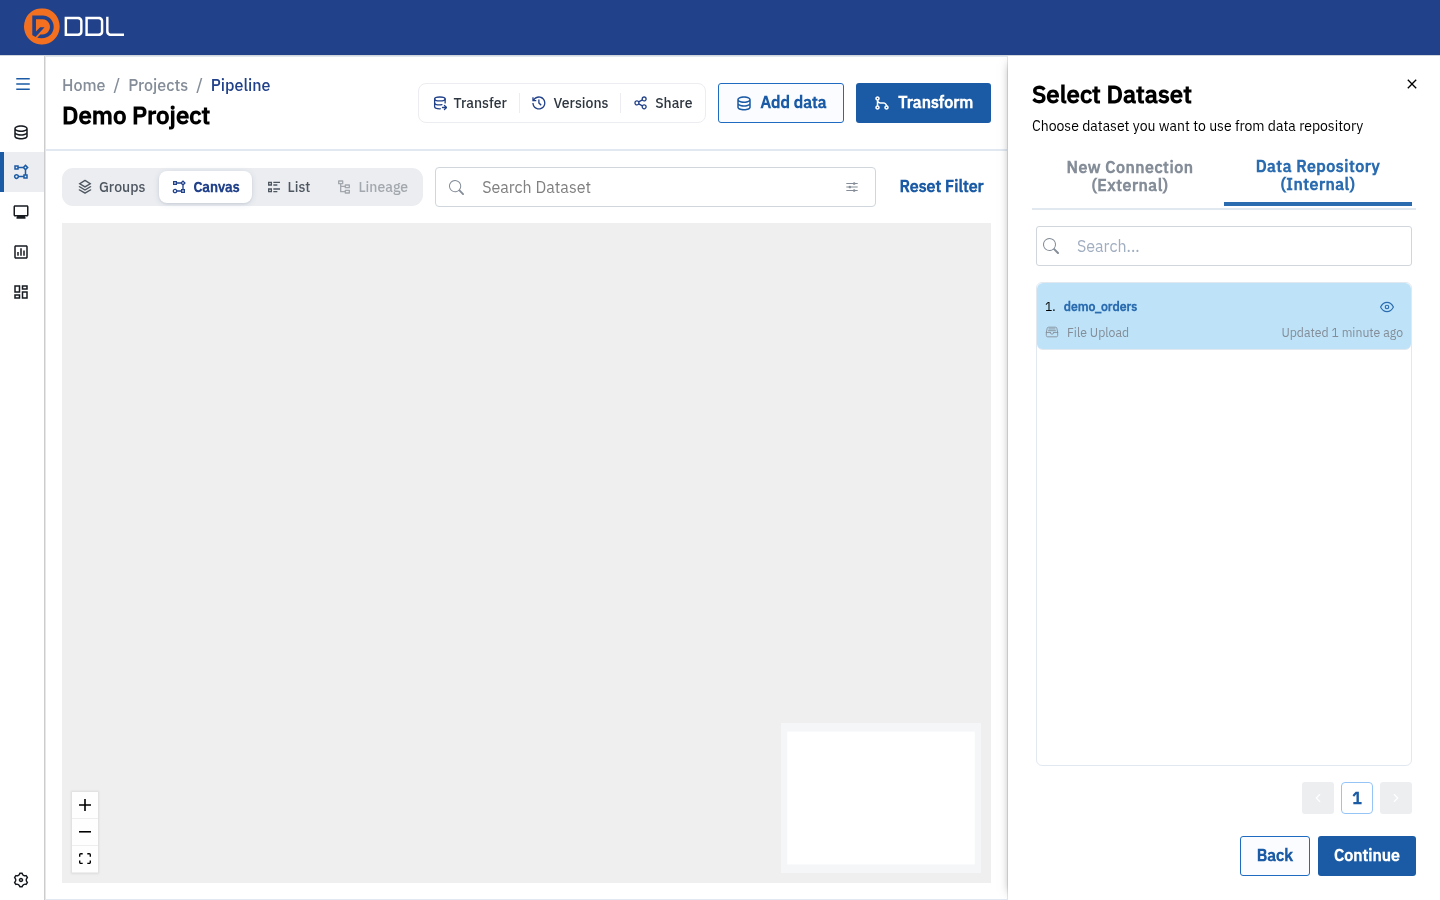 The selected dataset card.
On Import this dataset ("Write a name for your dataset representation"):
- Save As — the node name. This is the identifier you will type in backticks in SQL.
- Auto Sync from dataset source — keep the node in step with the repository dataset.
- Click Import Dataset (or Back to abandon).
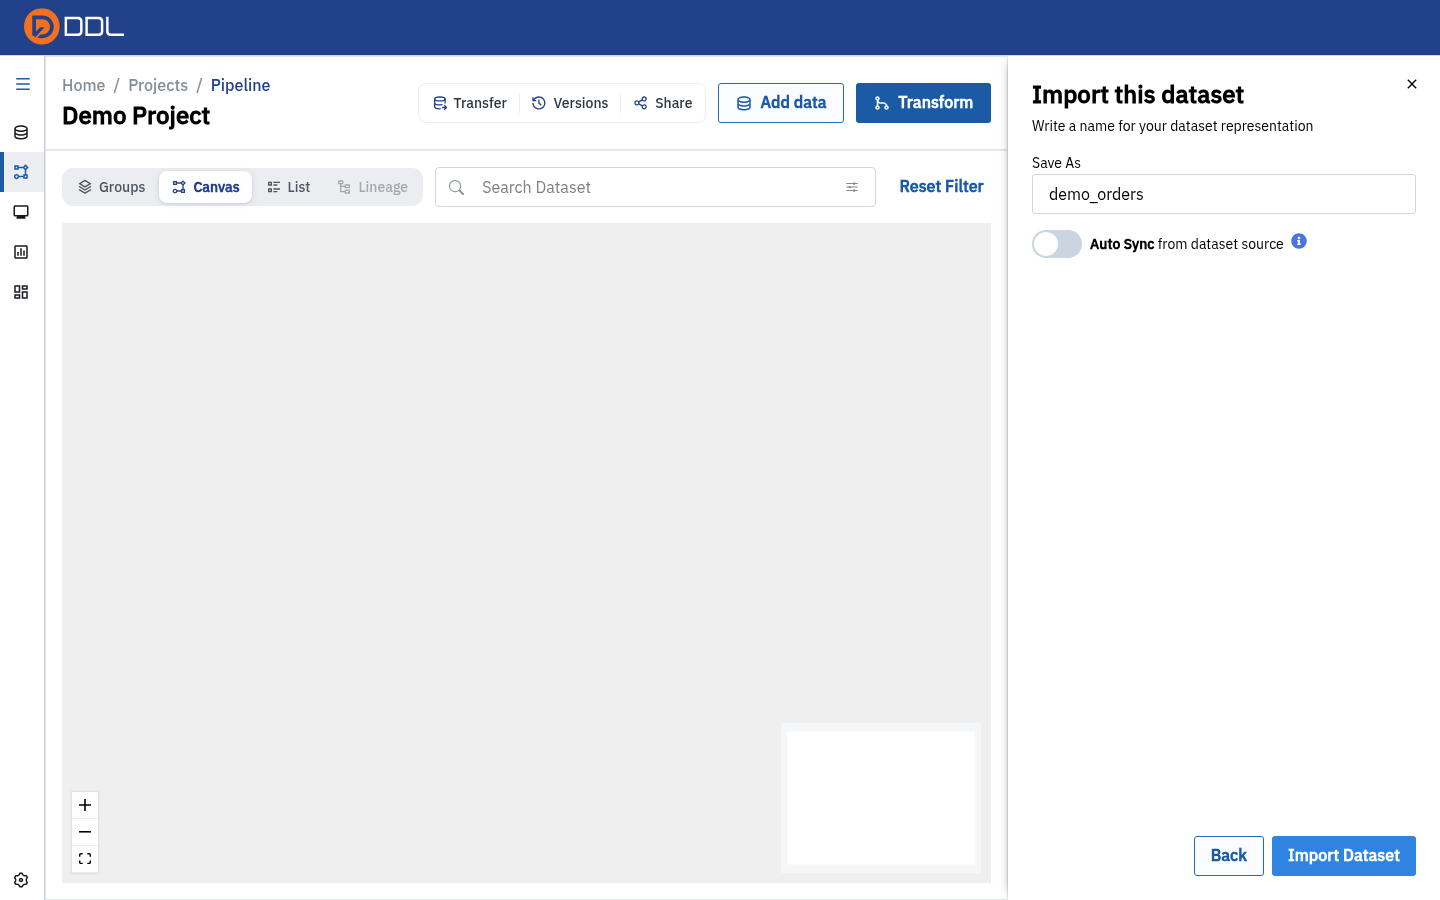 The final step: name, optional auto-sync, then Import Dataset .
- A node appears on the canvas with a status icon. Its layer is Source and its type reads
Dataset · Data Repository.
The node name is a contract
Everything downstream — SQL backticks, Merge/Union inputs, lineage labels — refers to this name. Rename after the fact and you must update every query that referenced it.
Work with a node
Click a node on the canvas to open its side panel.
 Node panel for demo_orders : lineage overview, result size, actions, Preview Data and Meta Data.
| Section / action | What it gives you |
|---|---|
| Show lineage | Jump to this node's lineage graph |
| Last run | Summary of the most recent run (No run yet before the first sync) |
| Lineage counts | n nodes upstream · n nodes downstream |
| Result table | Size on disk plus Count rows & columns |
| View | Opens the read-only node page (see below) |
| Duplicate | Clone the node |
| Sync ▾ | Sync now or Schedule sync |
| Preview Data | The full grid of the node's current contents |
| Meta Data | Owned By, Total Size, Latest Size, Created At, Updated At, Total Columns, Total Rows |
| Rename node (pencil in the header) | Change the node name |
| Delete | Remove the node — destructive, and downstream nodes lose their input |
Right-click a node for the context menu.
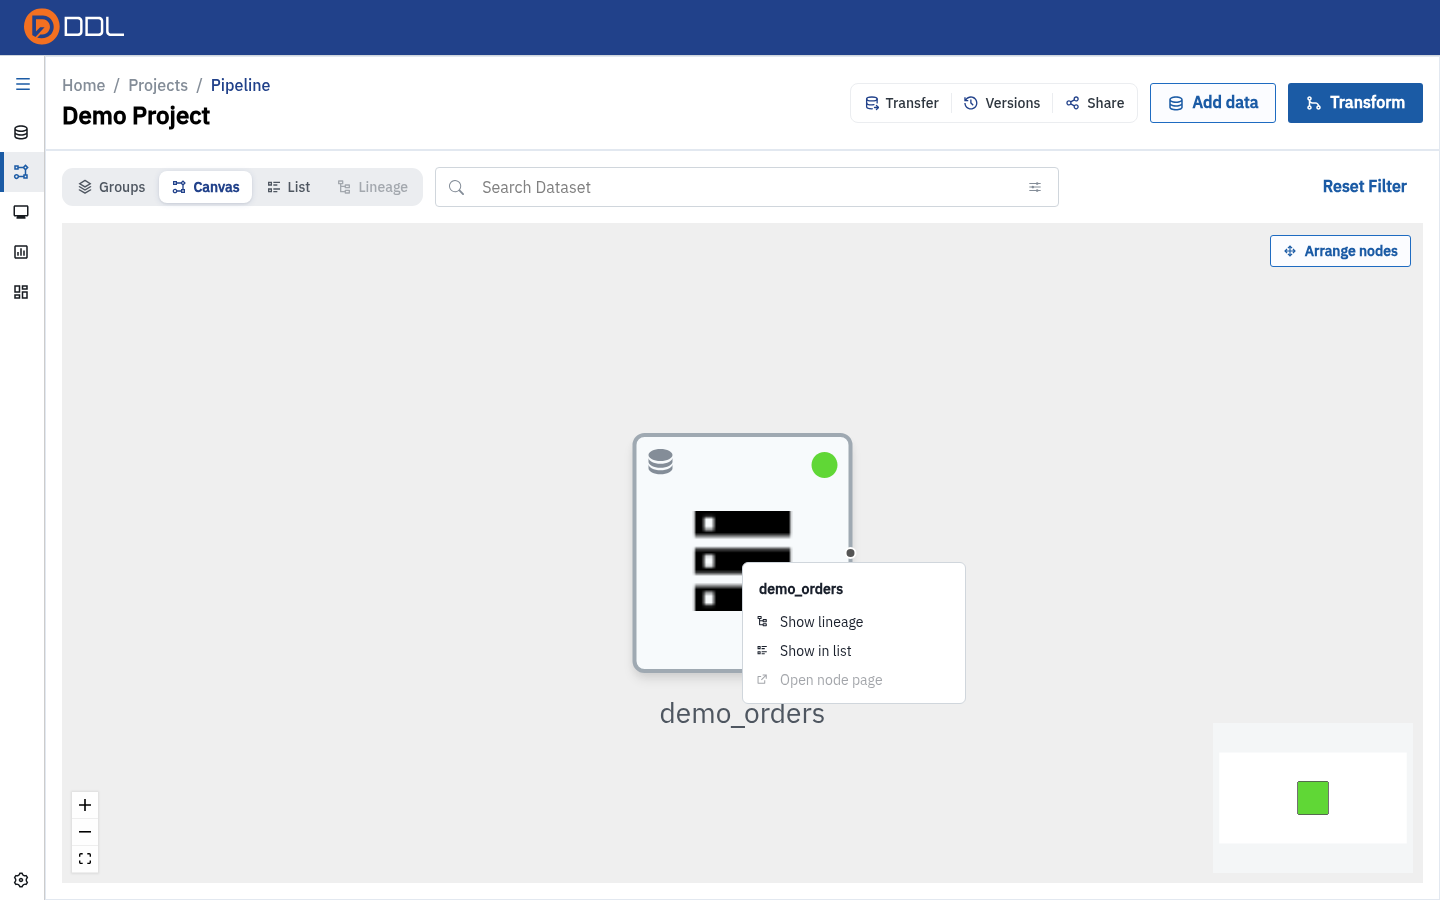 Show lineage · Show in list · Open node page.
Open node page is not always available
For a node imported from the Data Repository, Open node page is rendered but disabled. Use View in the node's side panel to reach the same read-only page. (Right-clicking empty canvas does nothing at all — there is no canvas context menu.)
Run it
Sync now
- Open the node panel and click the arrow next to Sync.
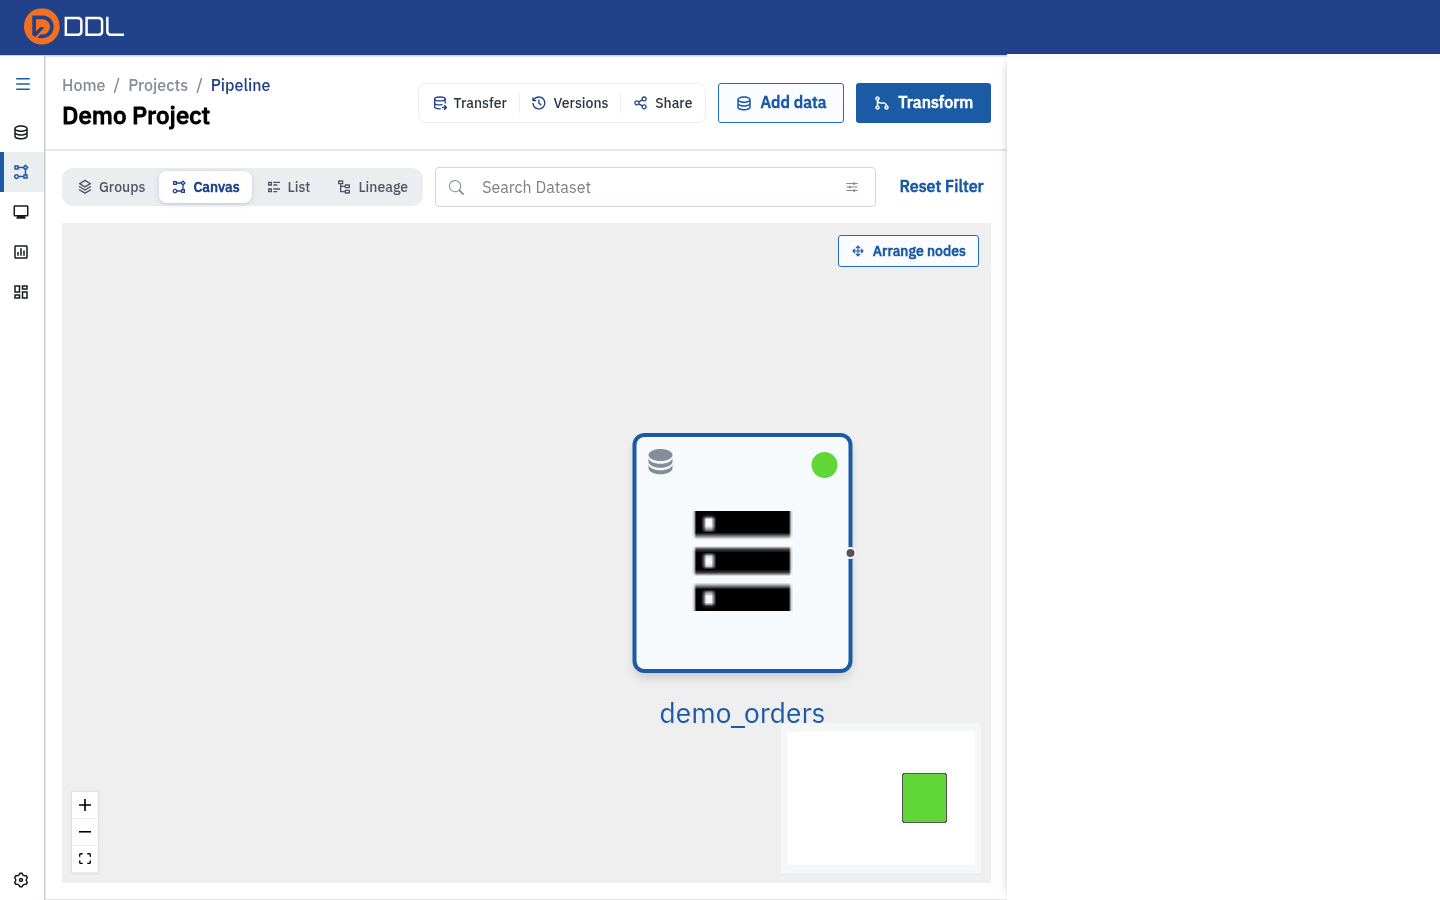 Sync splits into Sync now and Schedule sync .
- Choose Sync now. A toast confirms: "Node demo_orders sync process will be started shortly".
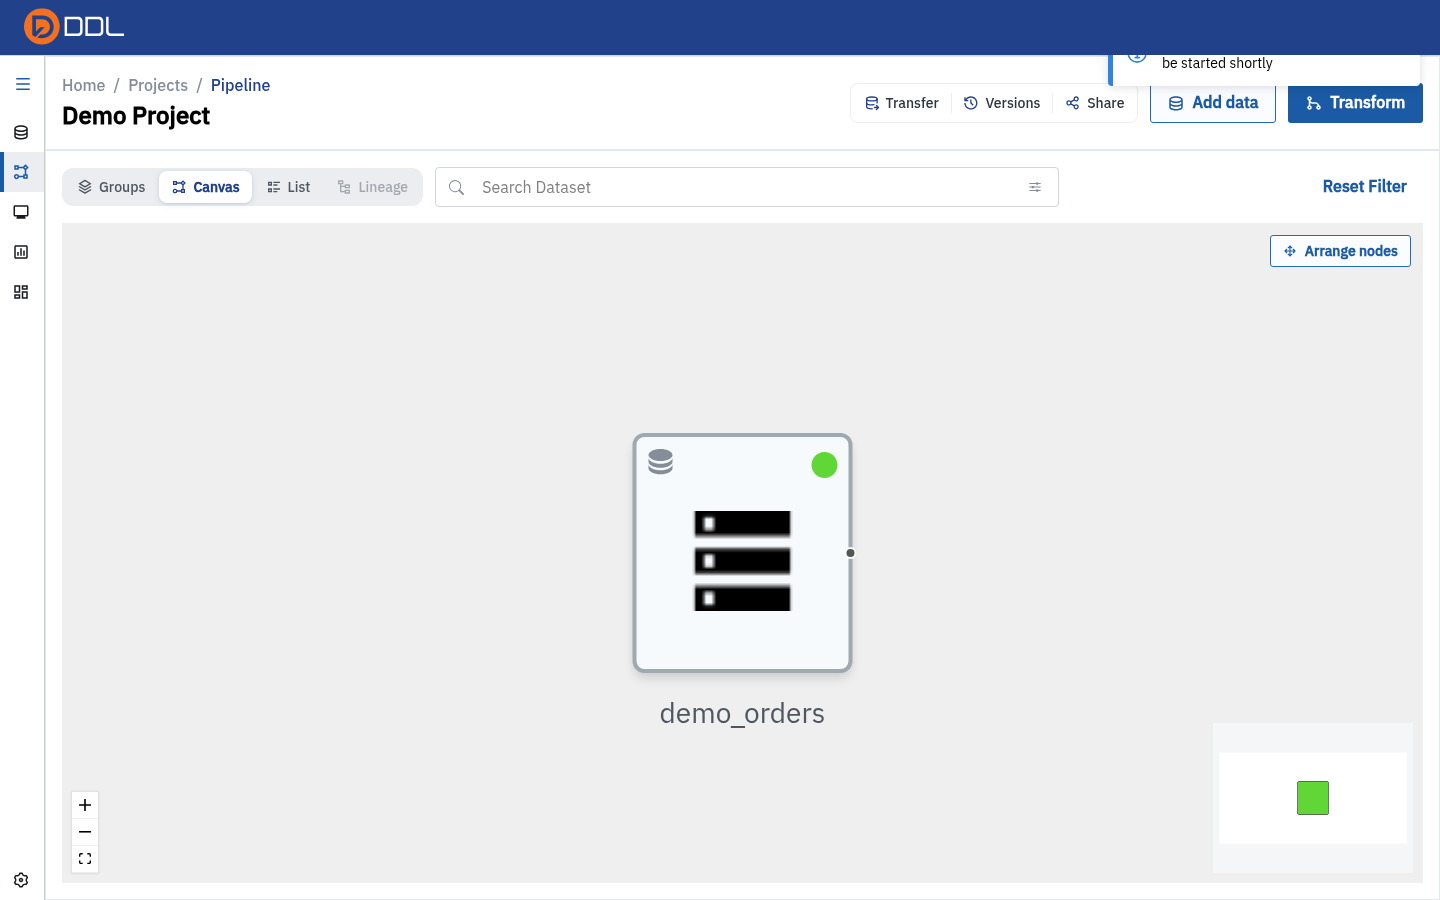 The toast appears immediately; the run itself is queued.
"Shortly" really means shortly
Monitoring is eventually consistent: the process row may not appear the instant you click. Do not re-click Sync now because the list looks empty — open Monitoring after a moment instead.
Schedule sync
Schedule sync opens the same two-step wizard as the project's Schedule tab. Full walkthrough: Schedules.
Transform: build new nodes from existing ones
Transform opens the Transform Data modal with five operations.
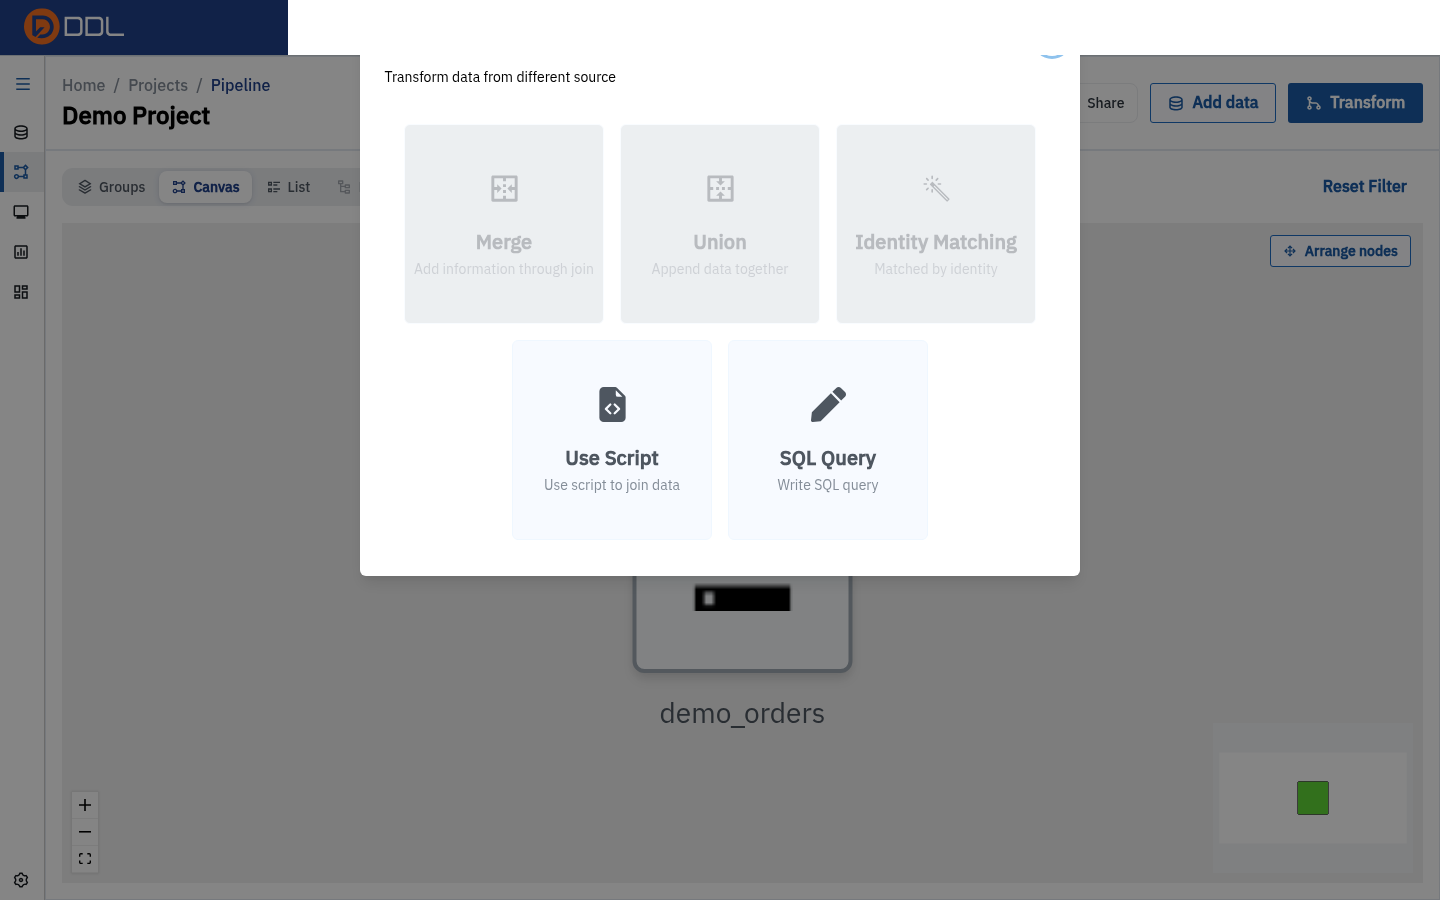 Merge · Union · Identity Matching · Use Script · SQL Query, each with its one-line caption.
| Option | Caption in the UI | What it opens |
|---|---|---|
| Merge | "Add information through join" | The Merge Table editor |
| Union | "Append data together" | The Union editor |
| Identity Matching | "Matched by identity" | The Identity Matching wizard |
| Use Script | "Use script to join data" | A side panel with Script List / Select Script tabs |
| SQL Query | "Write SQL query" | A SQL node — see SQL Query |
What each transform is for
Merge joins two tables side by side on key columns (SQL JOIN). Union appends tables of the same shape on top of each other (UNION ALL with column mapping). Identity Matching links records that describe the same real-world entity across datasets. Use Script runs a Python combine script. SQL Query expresses the transform as SQL and saves it as a node.
Merge
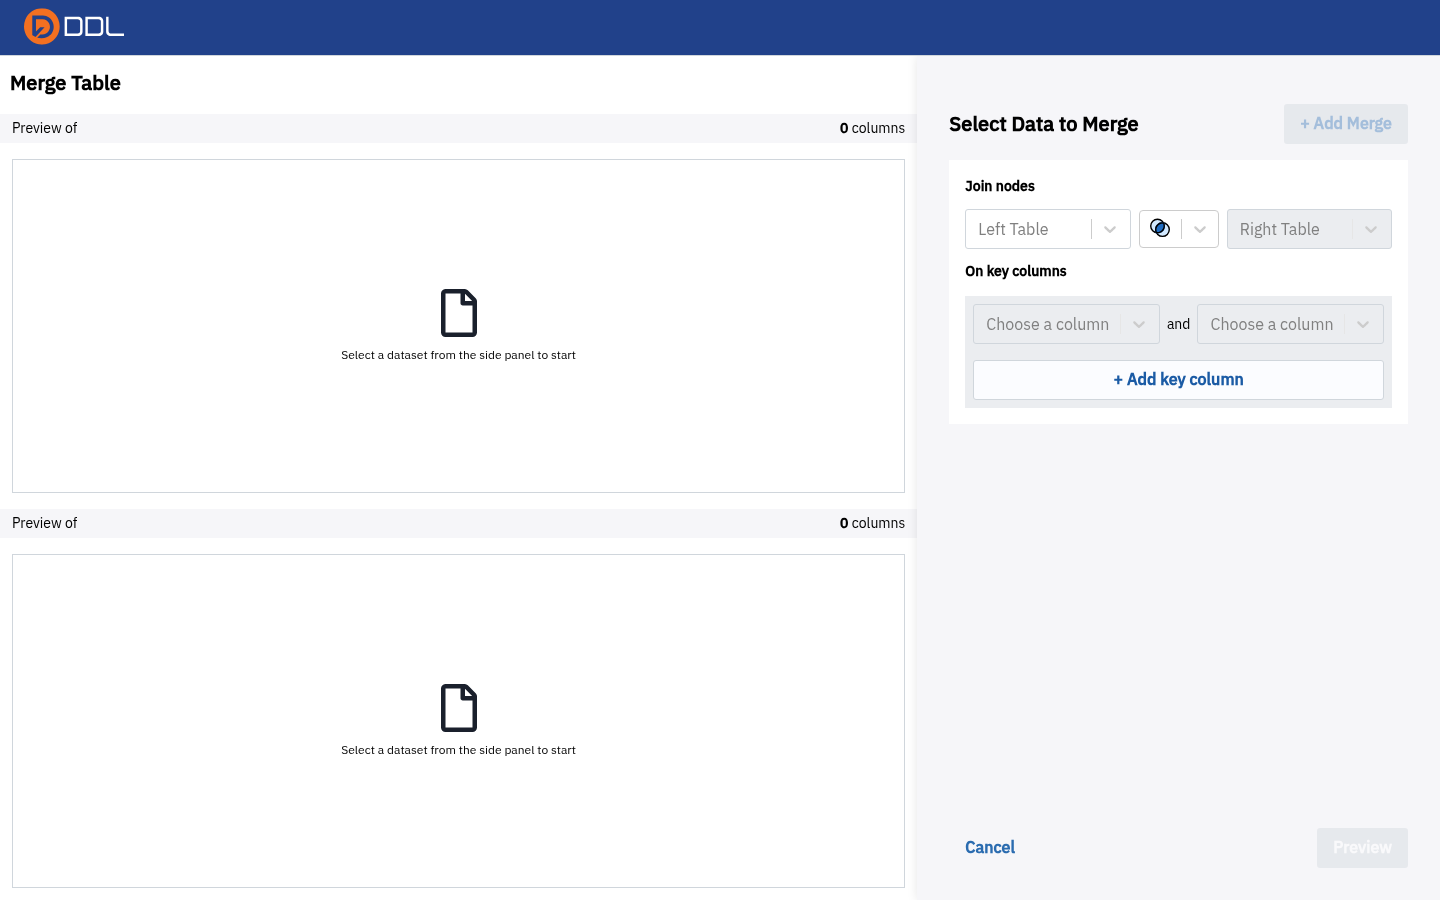 Join nodes: pick Left and Right datasets with Select Data to Merge , choose key columns under On key columns , add more keys with + Add key column , then Preview or Cancel from Join nodes ; the + Add Merge button starts another join.
Merge and Union both need two inputs. If your project contains only one dataset, the editors open in an empty state and you cannot define a join yet — import or build a second node first.
Union
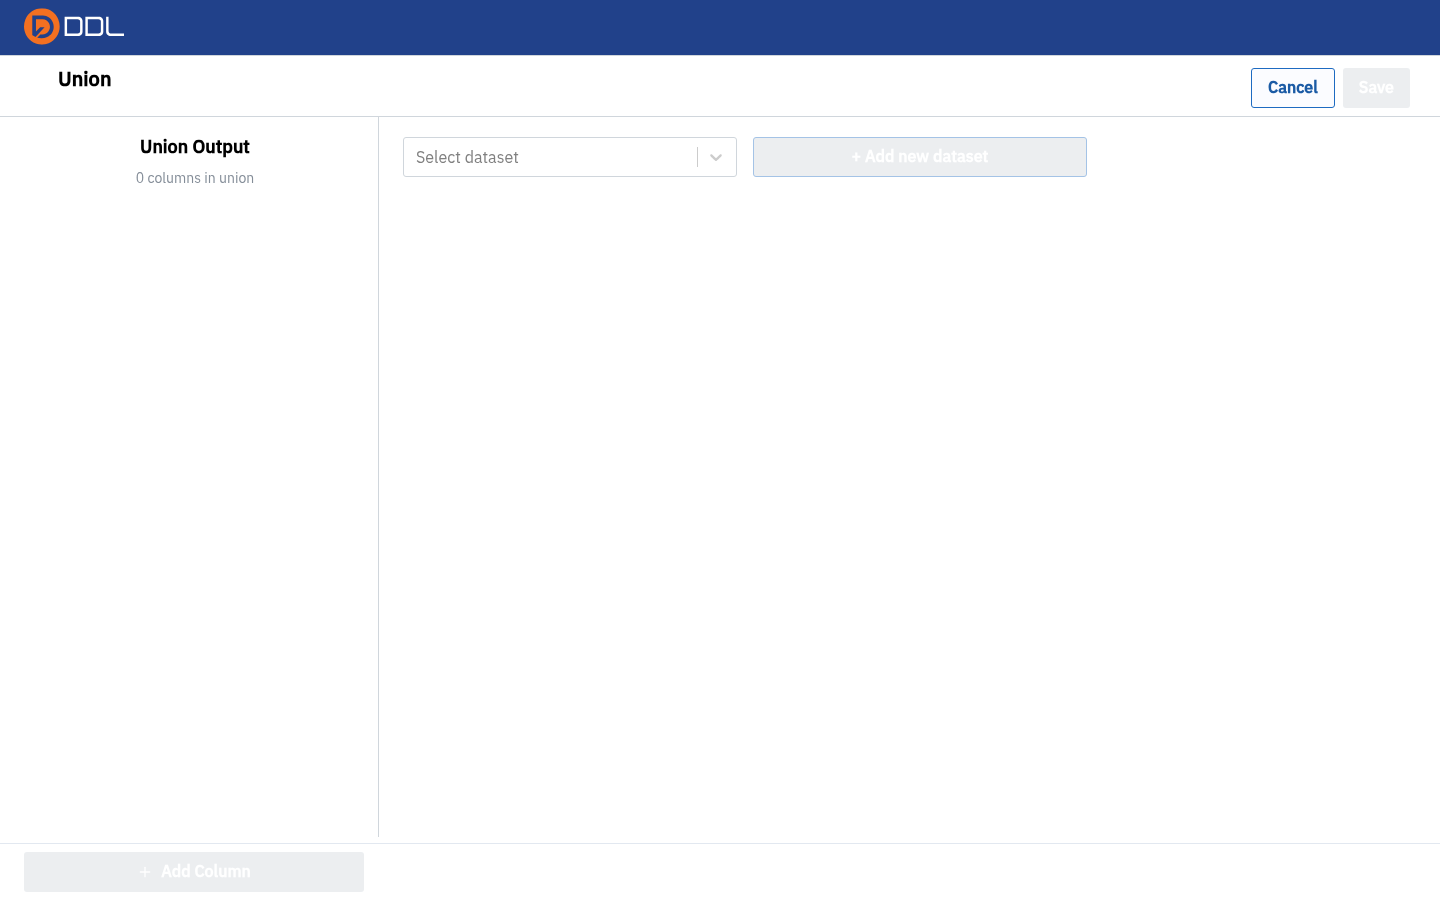 The Union editor: append datasets with Select dataset / + Add new dataset and align their fields with Add Column ; the Union Output pane counts the resulting columns.
The Union URL is different from the others
Union lives at /union/<projectId>. The seemingly obvious /projects/<id>/union returns the 404 page — always reach Union through Transform → Union.
Identity Matching
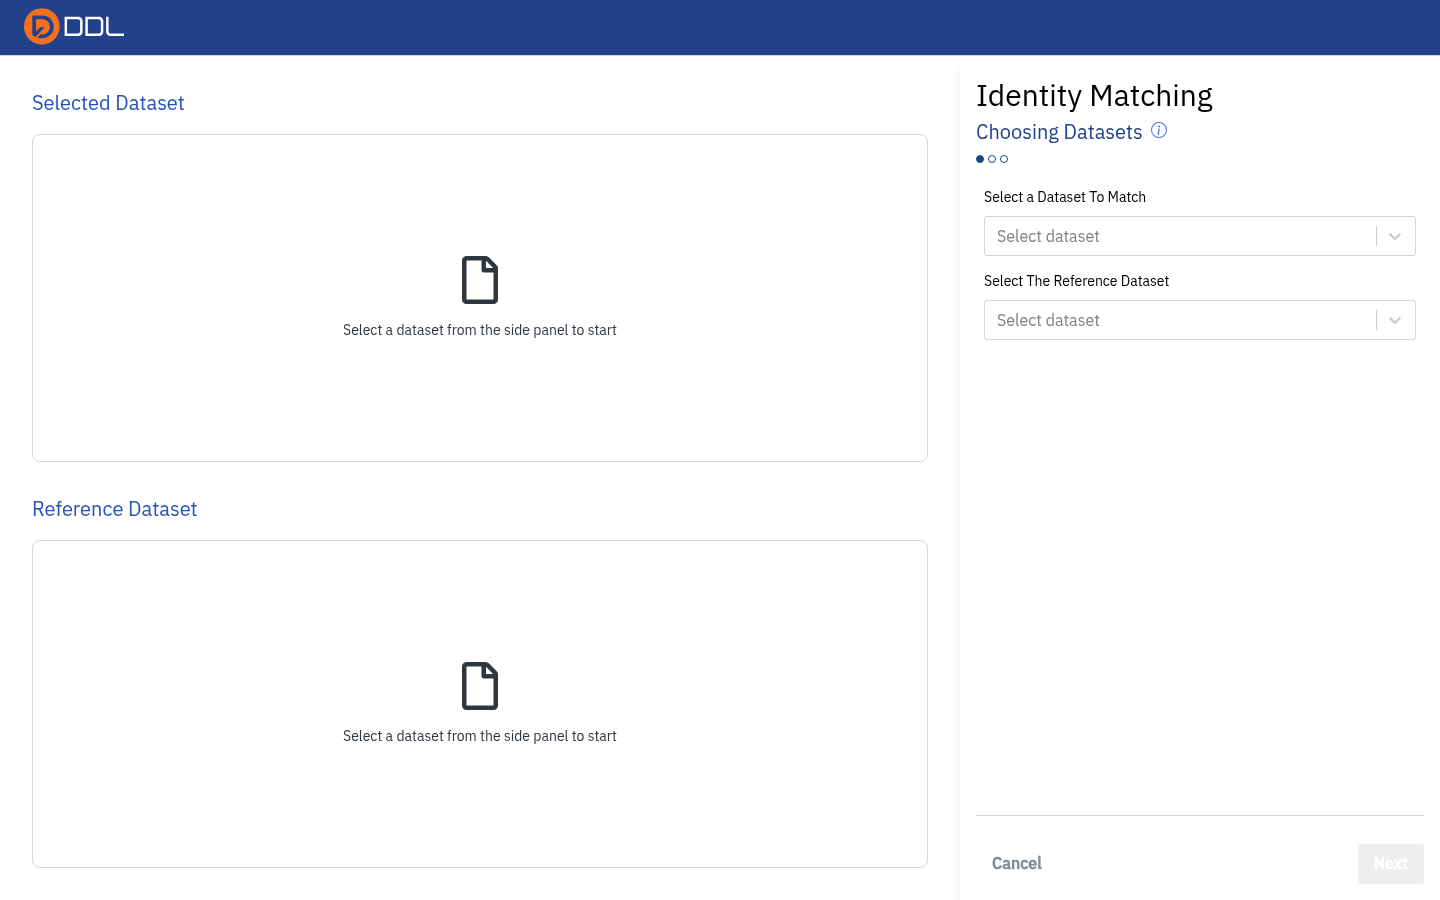 Step 1, Choosing Datasets : a Selected Dataset and a Reference Dataset pane, each with its own dropdown. Next stays disabled until both are chosen.
Use Script
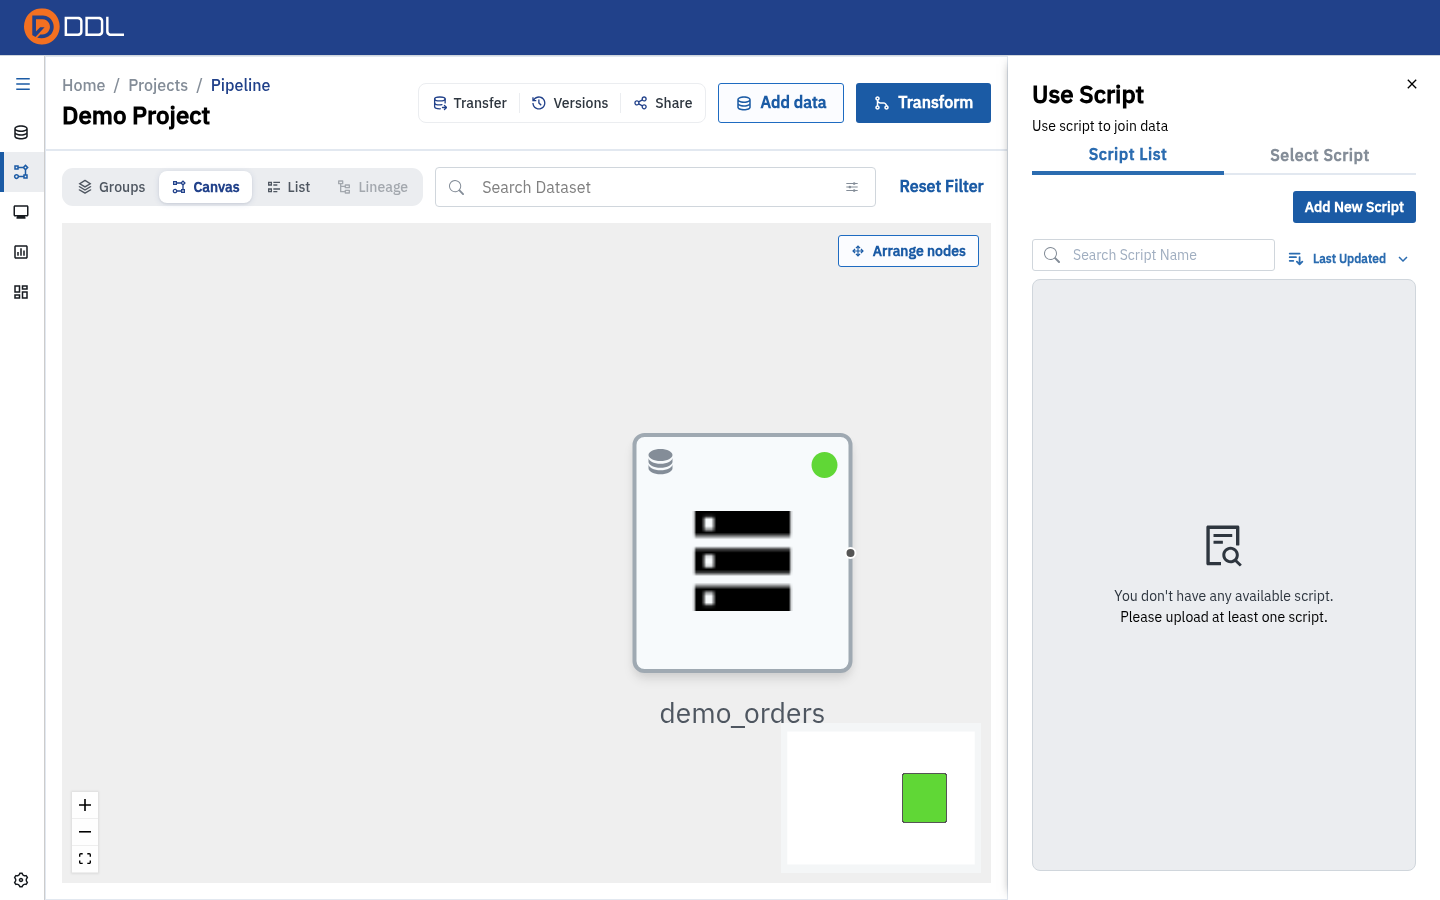 The Script List / Select Script panel. With no script uploaded it reads "You don't have any available script. Please upload at least one script."
Scripts are Python combine scripts; on instances where AI integration is enabled, scripts can also be created and run by an MCP token with Script access. See AI & MCP integration.
Transfer: move data out
Transfer on the toolbar opens the connector picker restricted to export-capable connectors — the destinations you registered on the Export tab.
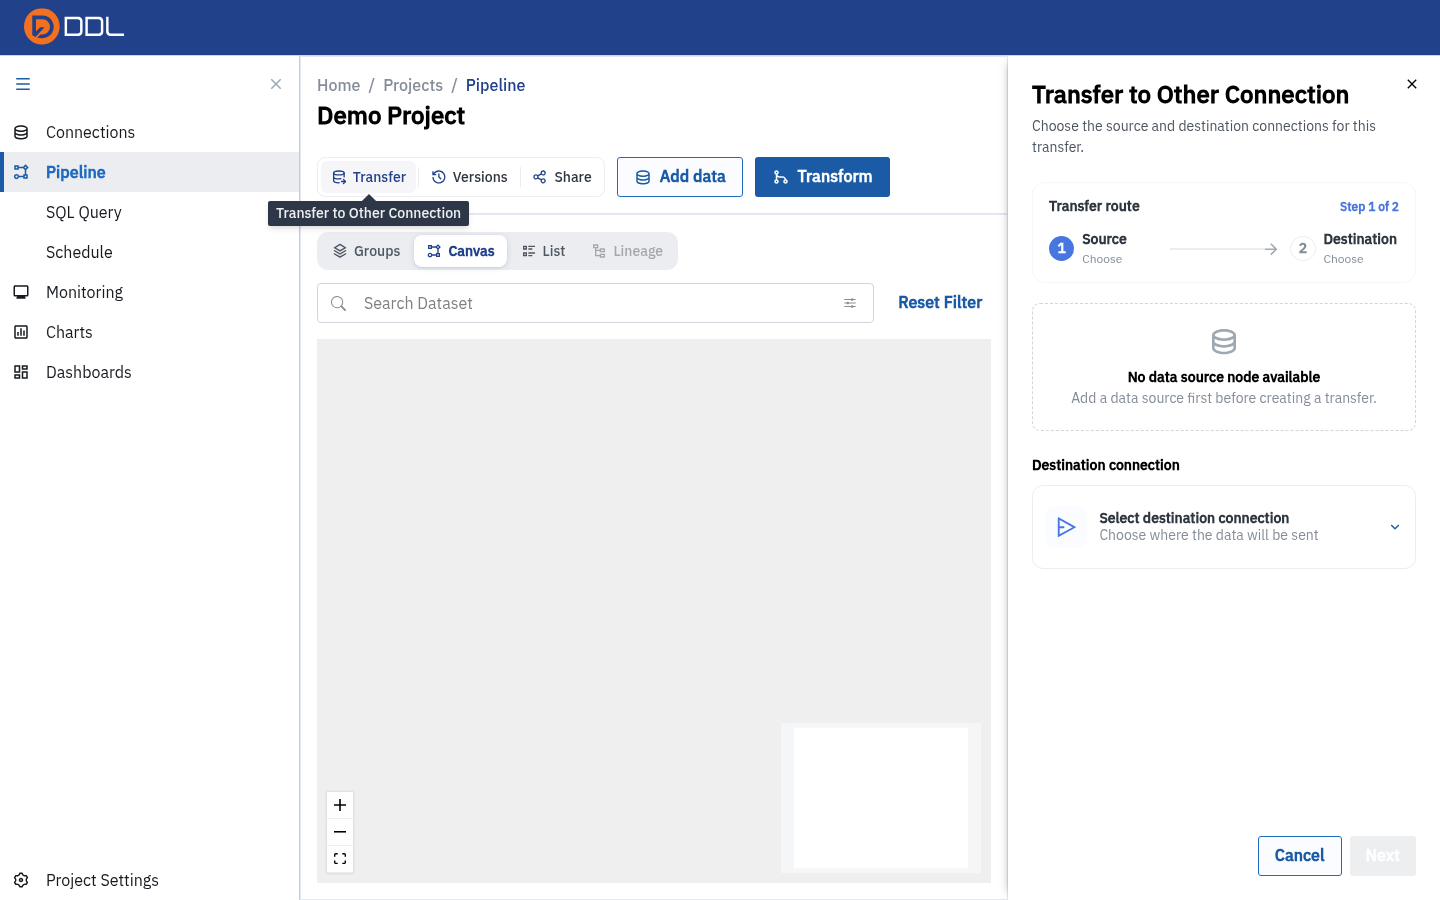 Choose where a node's output should be written.
WARNING
Transfer needs at least one saved Export connection to have anything to show. Create one first under Connections.
Four ways to look at the same pipeline
The view switcher offers Canvas, List, Lineage and Groups.
Canvas
The default react-flow board: drag nodes, wheel to zoom, drag to pan, use the bottom-left controls (zoom in, zoom out, fit/full-screen) and the minimap at bottom-right.
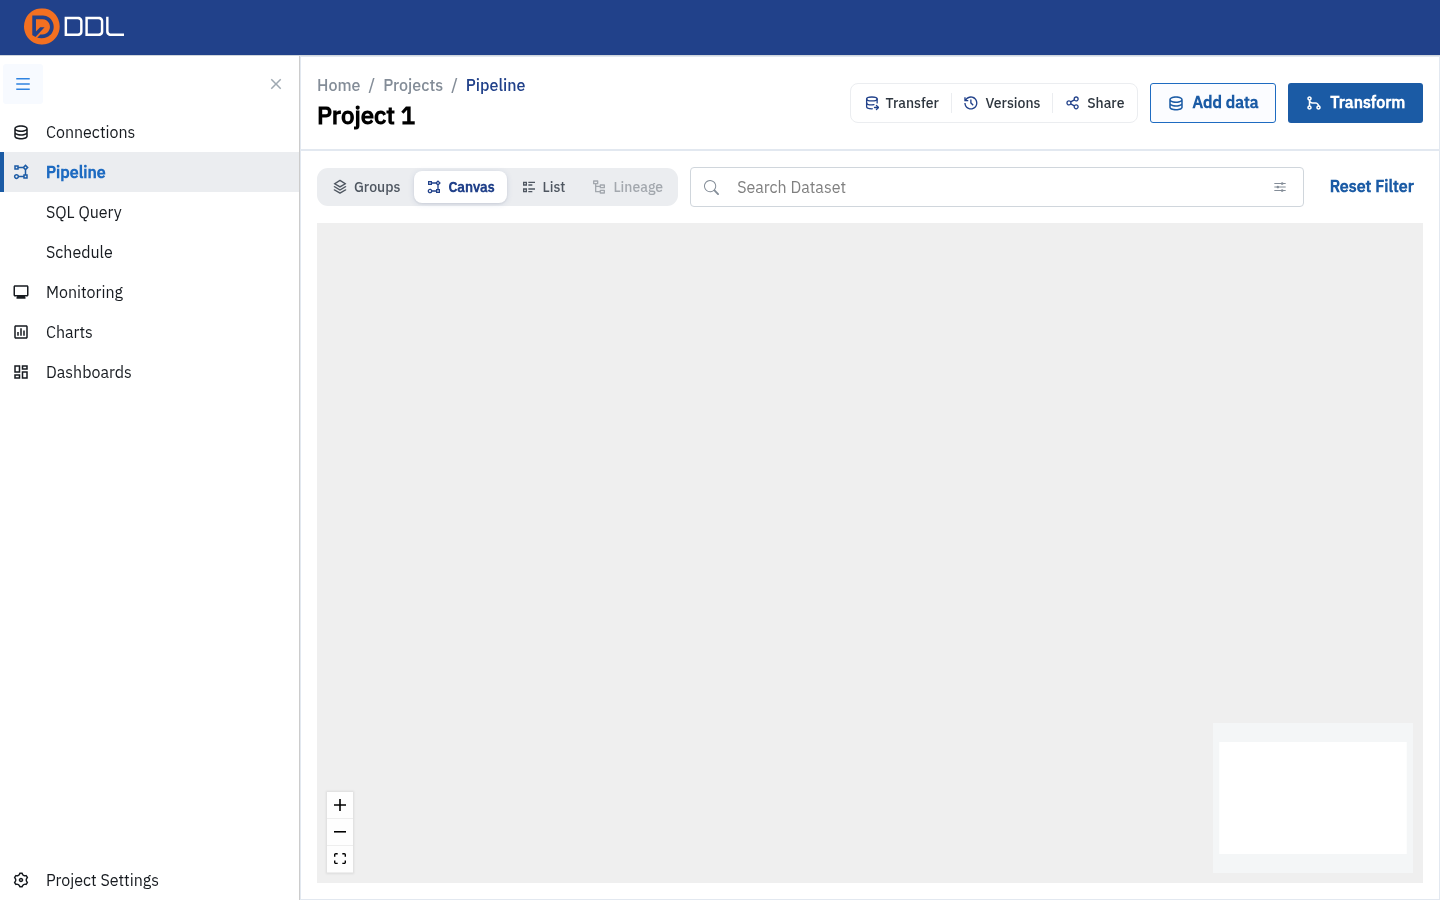 A brand-new project's canvas before any node exists.
Arrange nodes
After a few transforms the canvas gets messy. Arrange nodes re-lays out the DAG. To focus on one dataset, use Search Dataset and clear it again with Reset Filter.
List
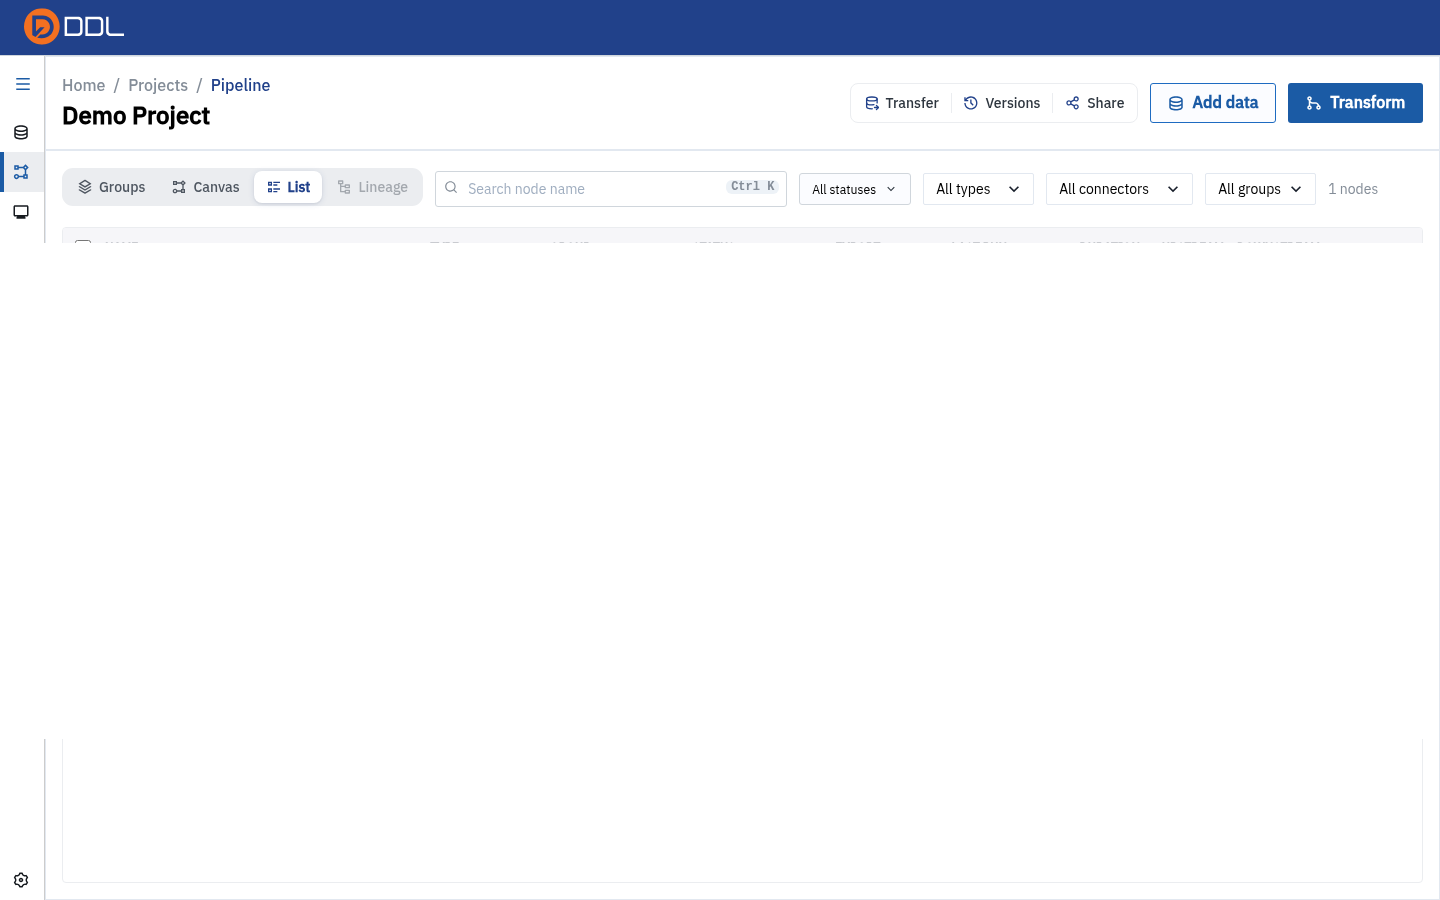 A table of every node with filters above it and eight sortable columns.
| Filter / column | Options |
|---|---|
| Search | Filter by node name |
| Status chips | All statuses · FAILED · WAITING · RUNNING · SCHEDULED · SUCCESSFUL |
| Type | Source · Transform · Transfer · File · Dataset |
| Connector | All connectors / each connector in use (e.g. Data Repository) |
| Group | All groups / each group |
| Sortable columns | NAME · TYPE · GROUP · STATUS · EXPORT · LAST RUN · DURATION · UPSTREAM · DOWNSTREAM |
| Node count | e.g. "1 nodes" |
| Select-all checkbox | Select every listed node |
List is the fastest way to spot a FAILED node when a pipeline has grown beyond what fits comfortably on screen.
Lineage
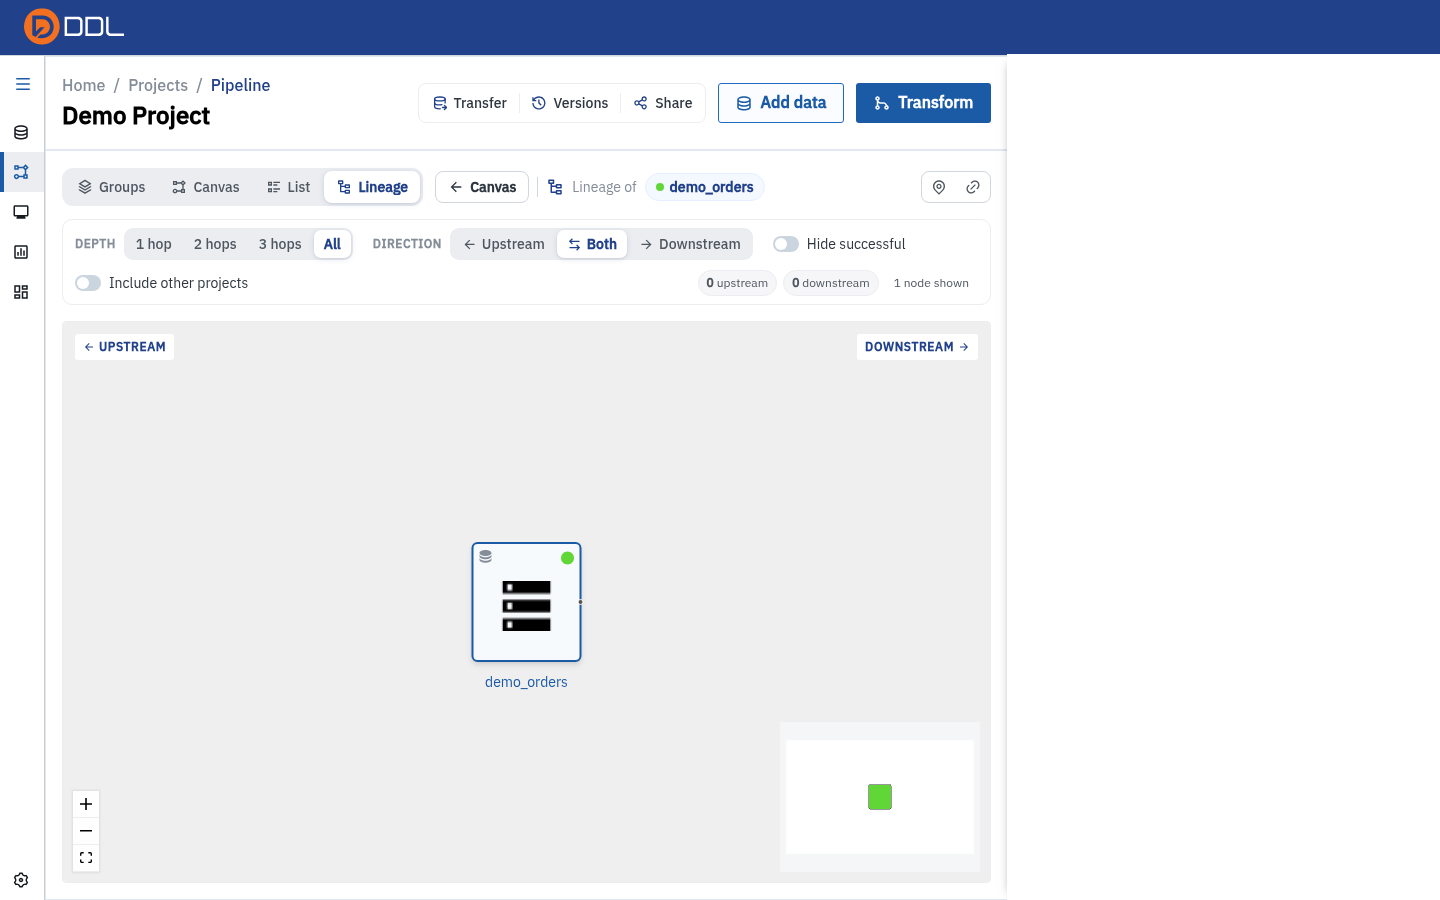 Lineage of one node, with DEPTH and DIRECTION filters, the hide-successful and other-projects switches, and a "0 upstream · 0 downstream · 1 node shown" stat line.
| Control | Options |
|---|---|
| DEPTH | 1 hop / 2 hops / 3 hops / All |
| DIRECTION | Upstream / Both / Downstream |
| Hide successful | Switch — remove green nodes to isolate problems |
| Include other projects | Switch — show nodes from other projects in the graph |
| Show on canvas / Copy link | Return to the canvas / copy a deep link to this lineage graph |
TIP
Copy link is the best way to answer "what feeds this table?" in a chat: the recipient opens the same graph, in the same scope, without you explaining it.
View switch blocked by the Groups panel
If the Groups view left its Project health panel open, another view may not open until you click empty canvas first.
Groups
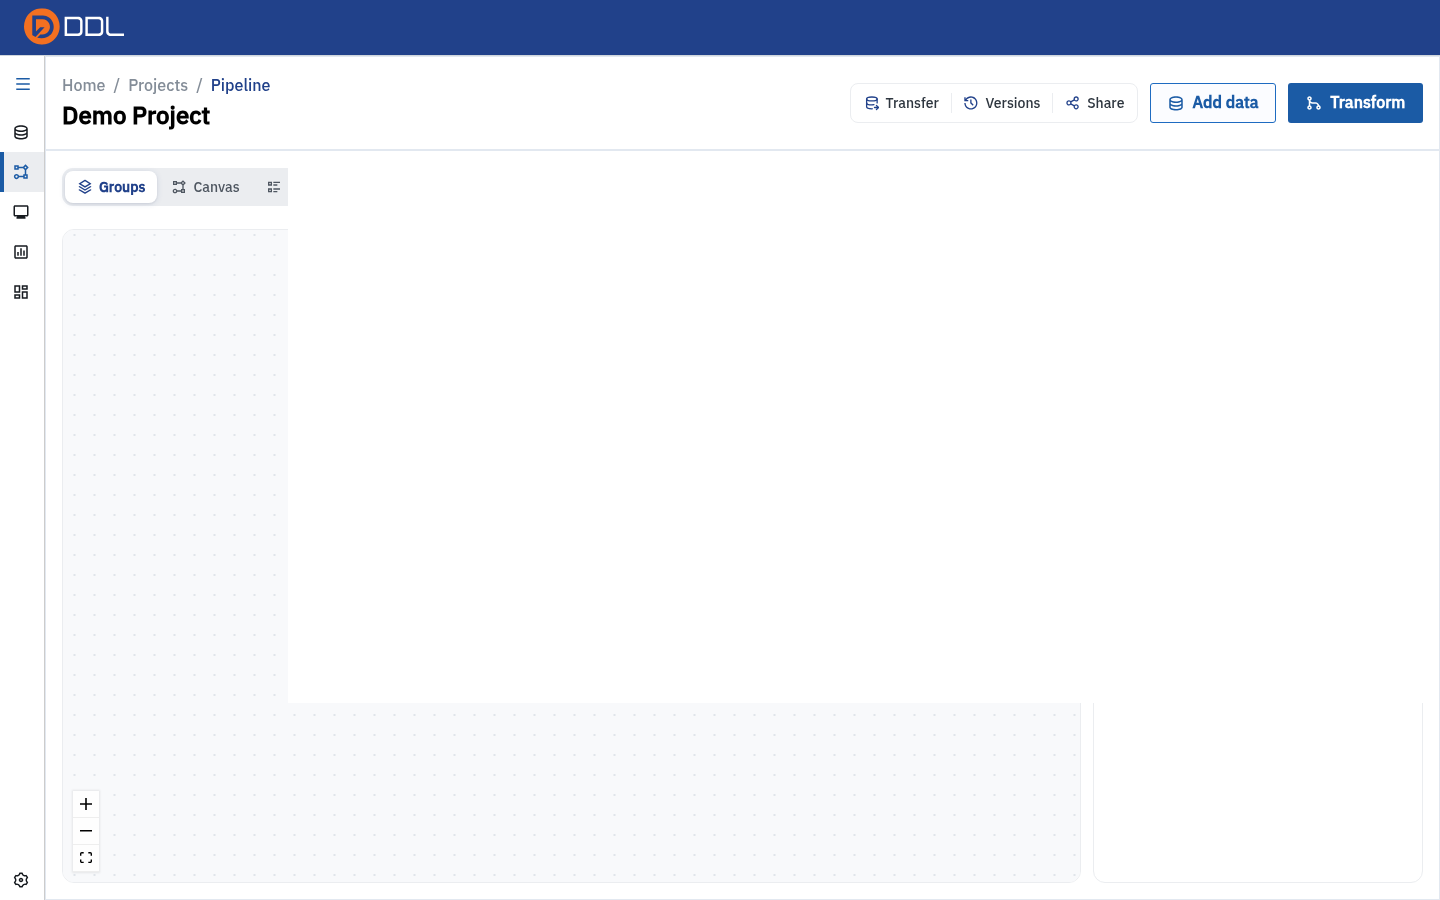 Nodes grouped into blocks with a Group by selector and a Project health panel listing Successful / Failed / Waiting / Running counts.
Group by offers Layer, Data source and Folder. Each block shows a status dot and a summary such as "1 node · all OK"; Open jumps into the group, and the Project health panel answers "is anything broken?" at a glance.
Inspect a node in read-only mode
View in the node panel opens /node/<nodeId> — a shareable, read-only page.
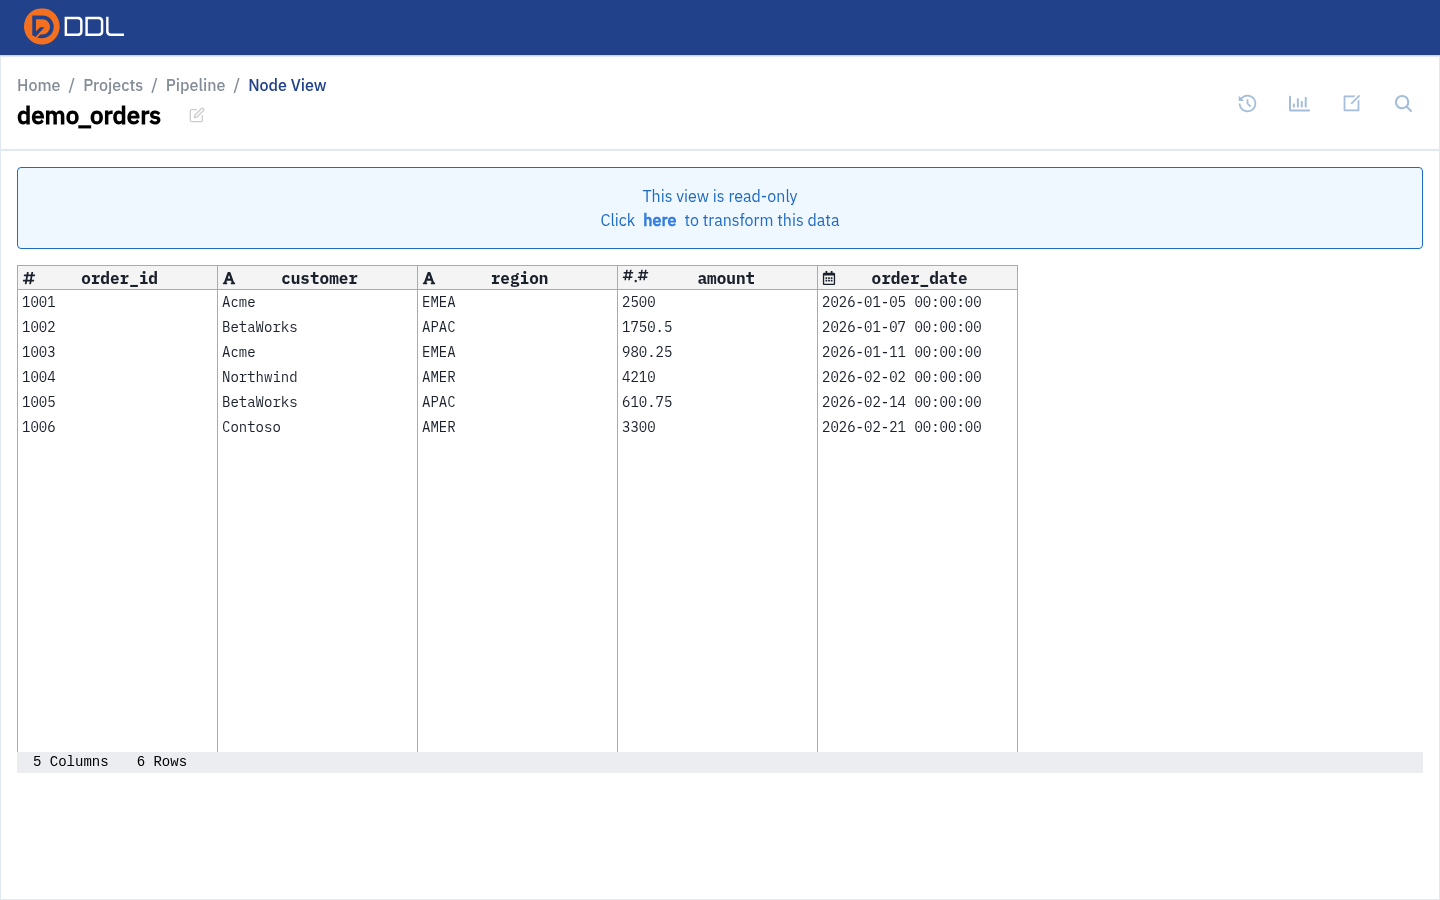 Breadcrumb Home / Projects / Pipeline / Node View , the banner "This view is read-only" with a Click here to transform this data link, the full data grid and a 5 Columns / 6 Rows footer.
This is the page to send someone who only needs to see the data — no editing is possible from it, and the inline link takes them to the transform flow if they need to change something.
Versions and rollback
The toolbar's Versions button opens the project history: pick a node, pick a date and time, then Preview the old state or Dump Data to export it.
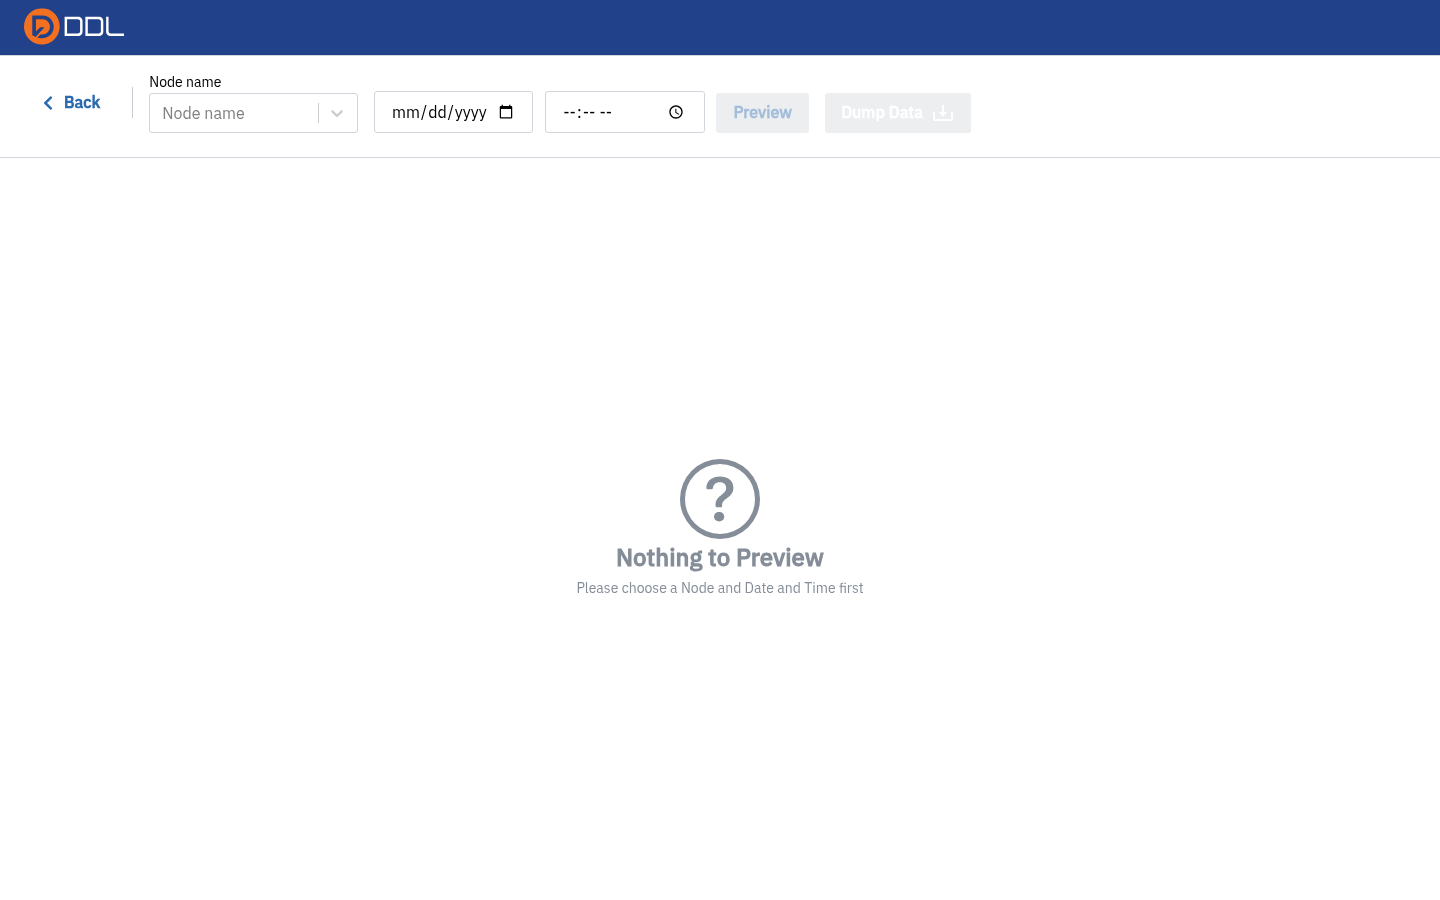 A node and timestamp chosen, ready to preview.
Details: Projects → Versions.
Gotchas worth knowing
| Situation | What actually happens |
|---|---|
| Project has one dataset and you click Transform → Merge | The editor opens empty — a join needs two inputs |
| You right-click empty canvas | Nothing. The context menu is per-node only |
| Open node page greyed out in the context menu | Expected for Data-Repository-imported nodes; use View in the panel |
| Sync toast appears but Monitoring is empty | Runs are queued; Monitoring lags |
| You renamed a node and SQL broke | Queries reference the old backticked name — update them |
| Union returns a 404 | Use Transform → Union, not /projects/<id>/union |
Next: SQL Query · Related: Data Repository, Connections, Schedules, Monitoring