
SQL Query
Purpose: a multi-tab SQL workbench over the nodes in your project (/projects/<id>/sql-query). Queries run on DDL's warehouse — a PostgreSQL engine, so the errors you see are real PostgreSQL errors — and a saved query becomes a pipeline node, which is how SQL joins the ETL DAG.
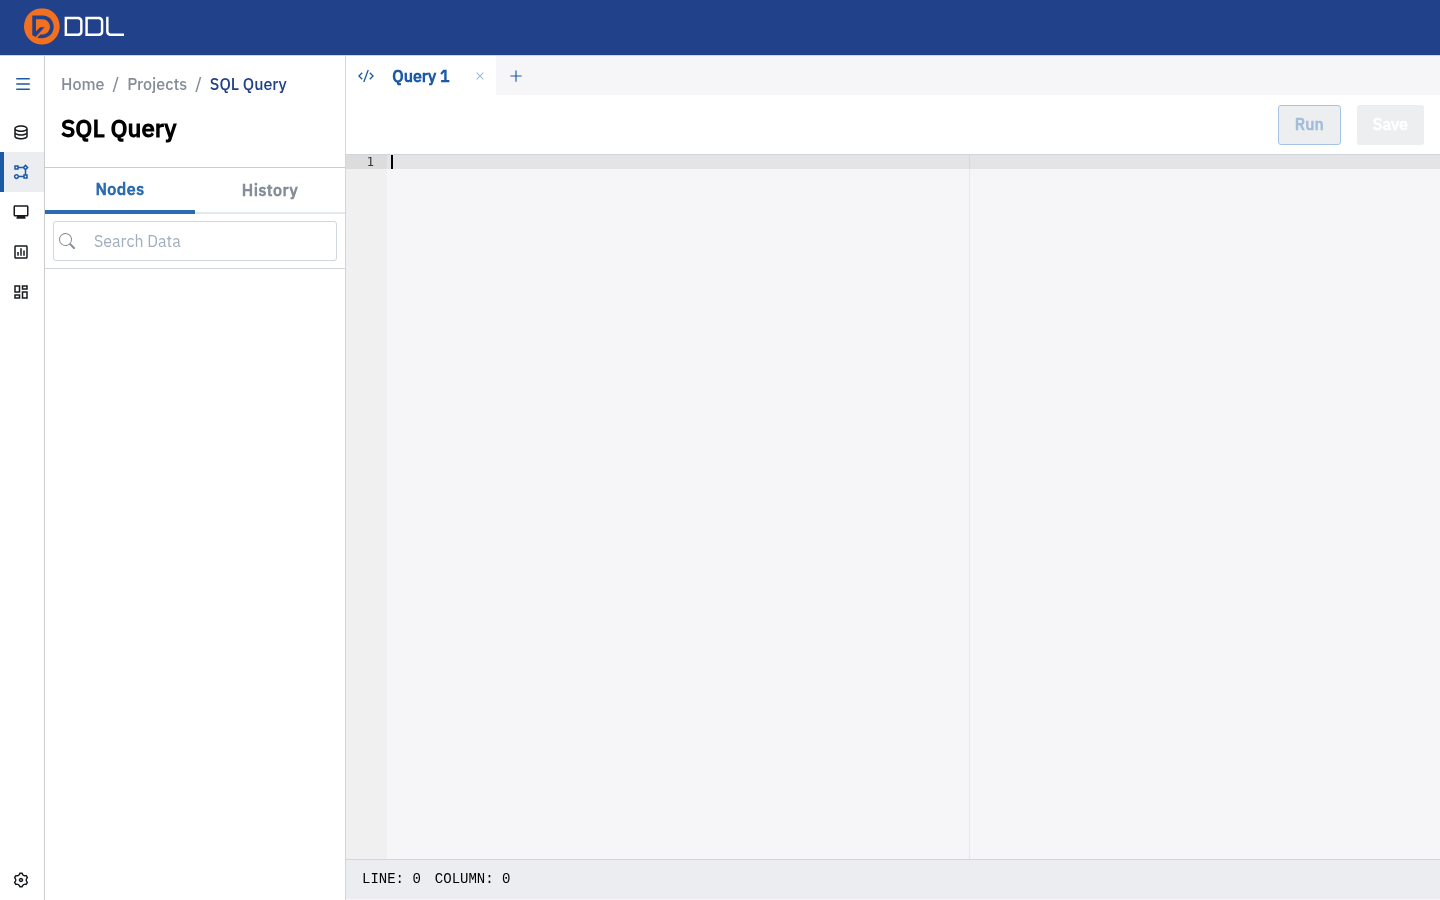 Fresh SQL Query page: Nodes / History panel on the left, a Query 1 tab, the Run and Save buttons, and an empty editor.
Page tour
| Area | What it holds |
|---|---|
| Side panel tabs | Nodes (what you can query) and History (what you ran) |
| Node search | Placeholder Search Dataset; Ctrl+K focuses it |
| Node list | One entry per project node; expand it to list its columns |
| Per-node ⋮ menu | View Data — writes and runs a correct query for you |
| Query tabs | Query 1, Query 2, … — + adds a tab, ✕ closes one |
| Editor header | Run and Save |
| Code editor | Ace editor with a LINE / COLUMN indicator |
| Result tabs | Data, Details, Logs (plus Refresh Log inside Logs) |
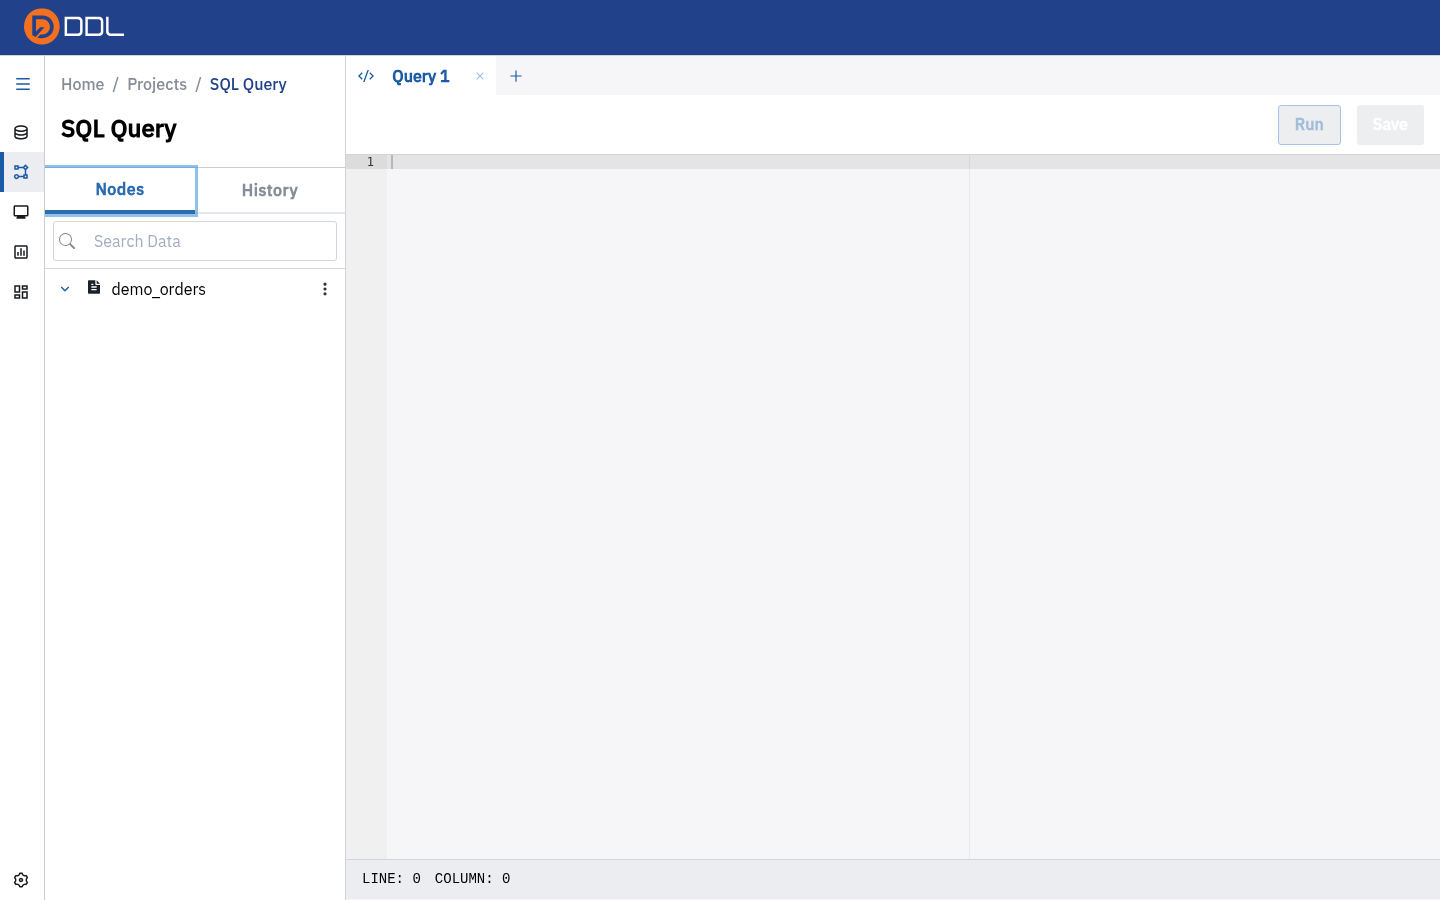 The Nodes tab lists the project's queryable nodes — the only "schema tree" the workbench has.
Write and run a query
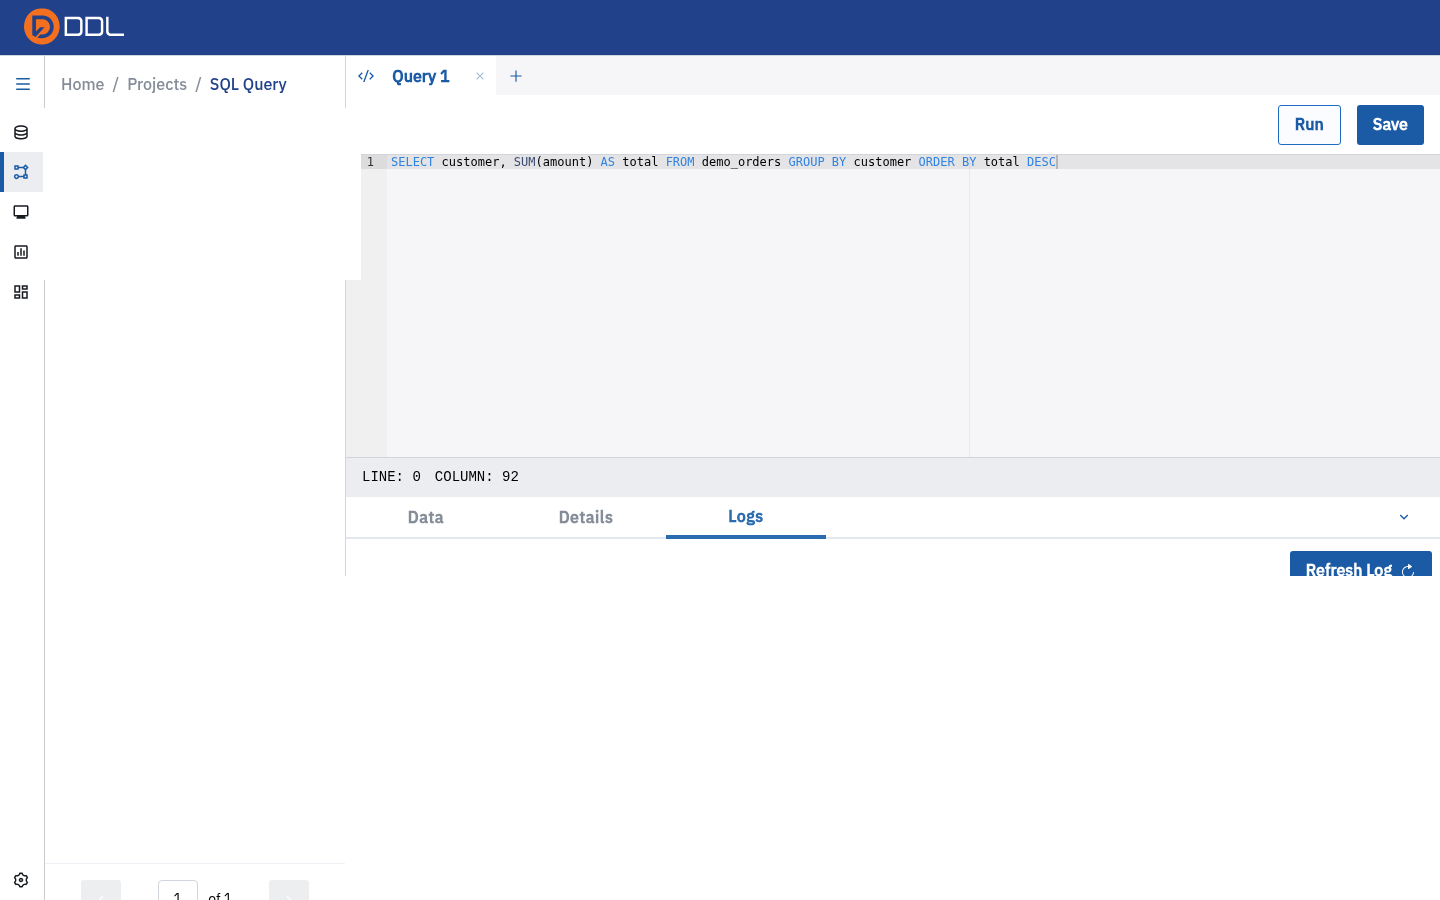
- Click into the editor and type your statement.
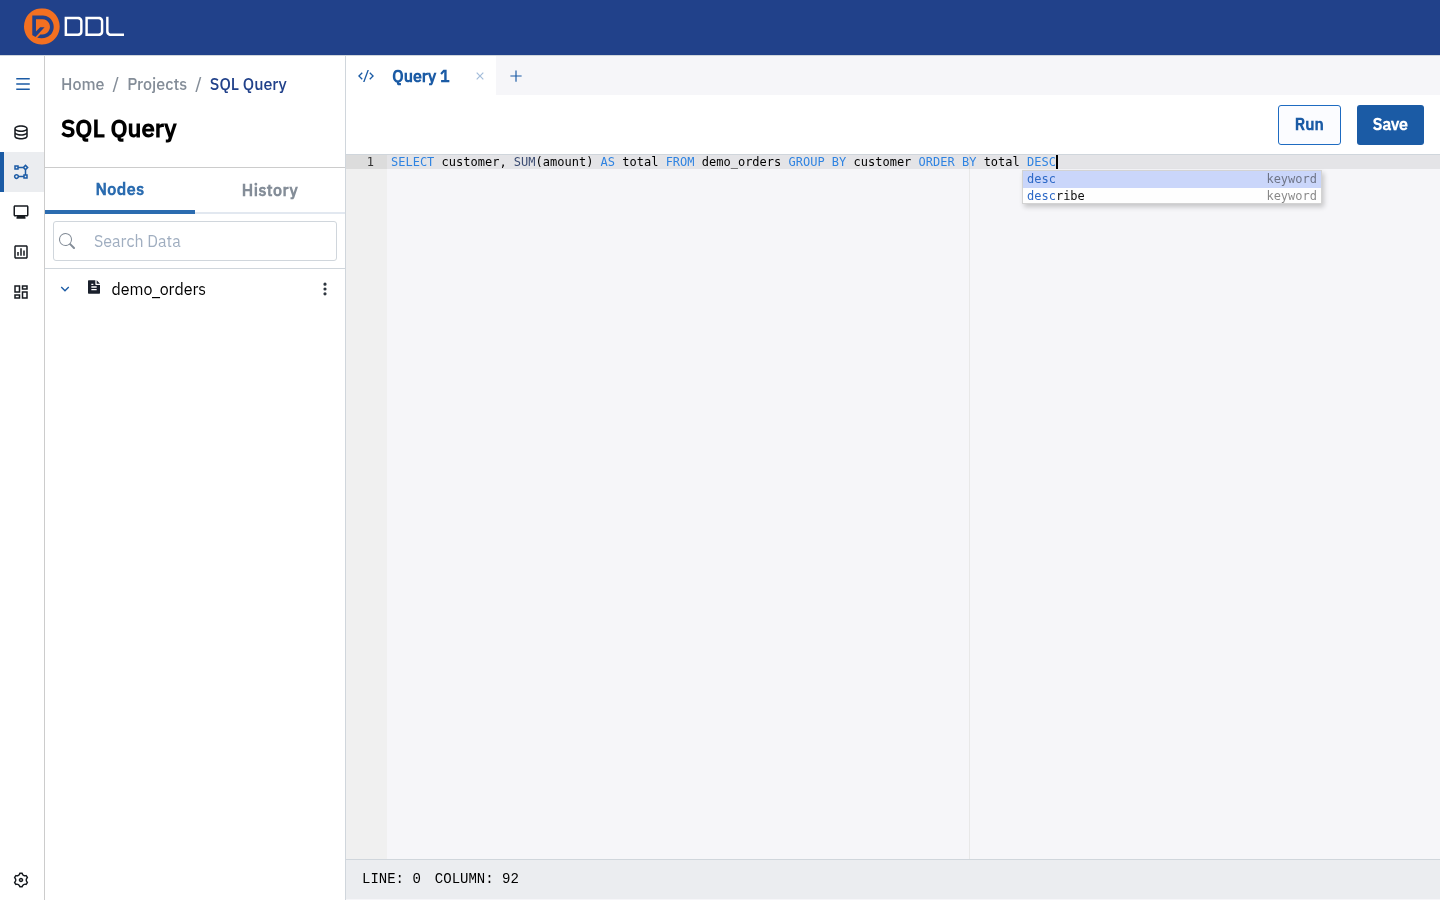 An aggregate query typed into the editor; the cursor indicator tracks LINE / COLUMN.
- Click Run.
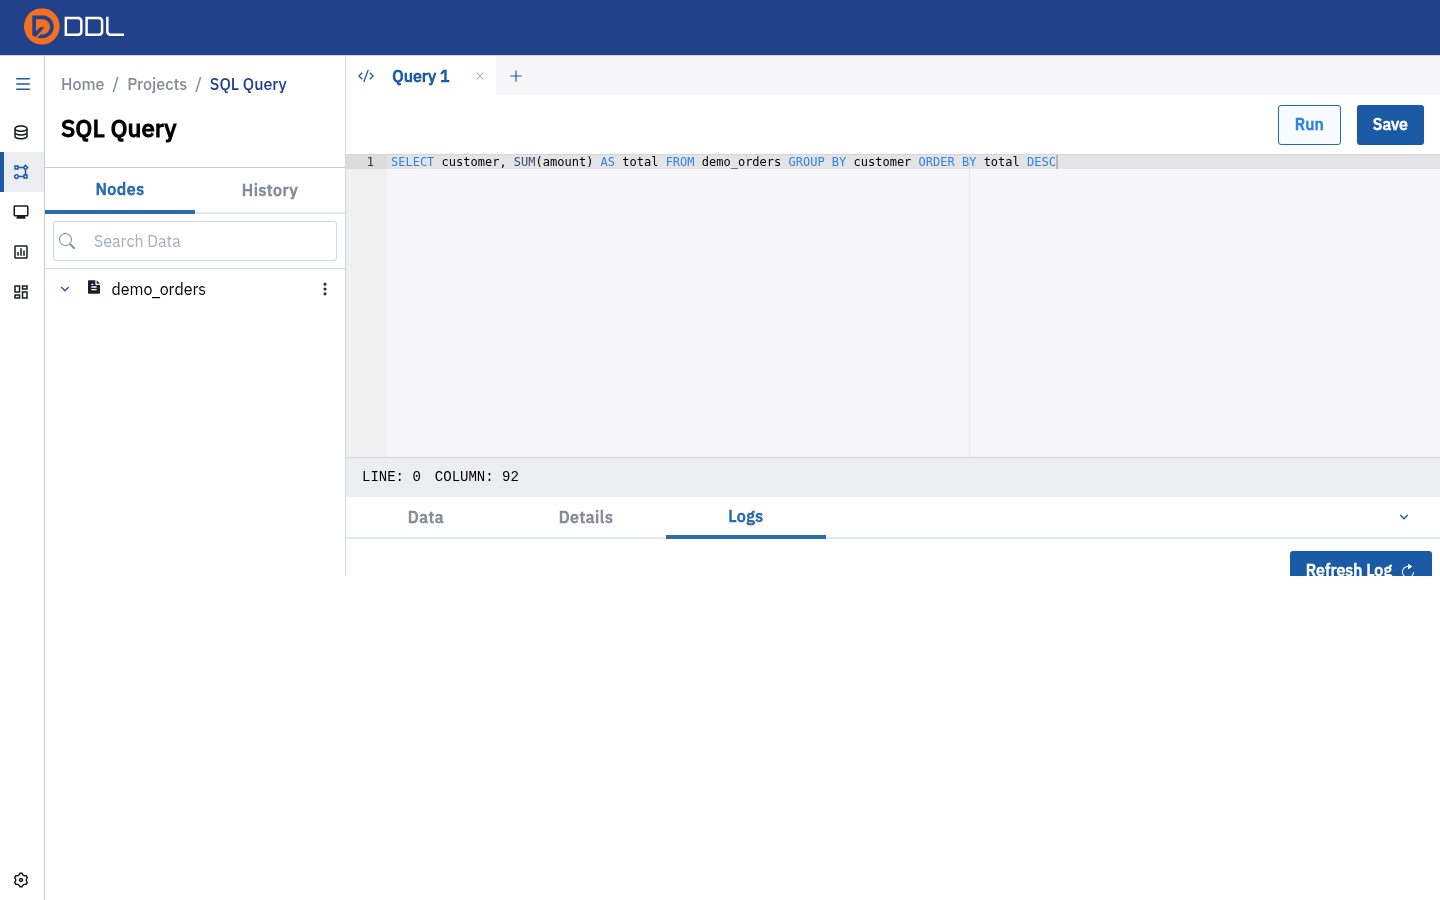 The result grid opens under the Data tab.
- Read the outcome:
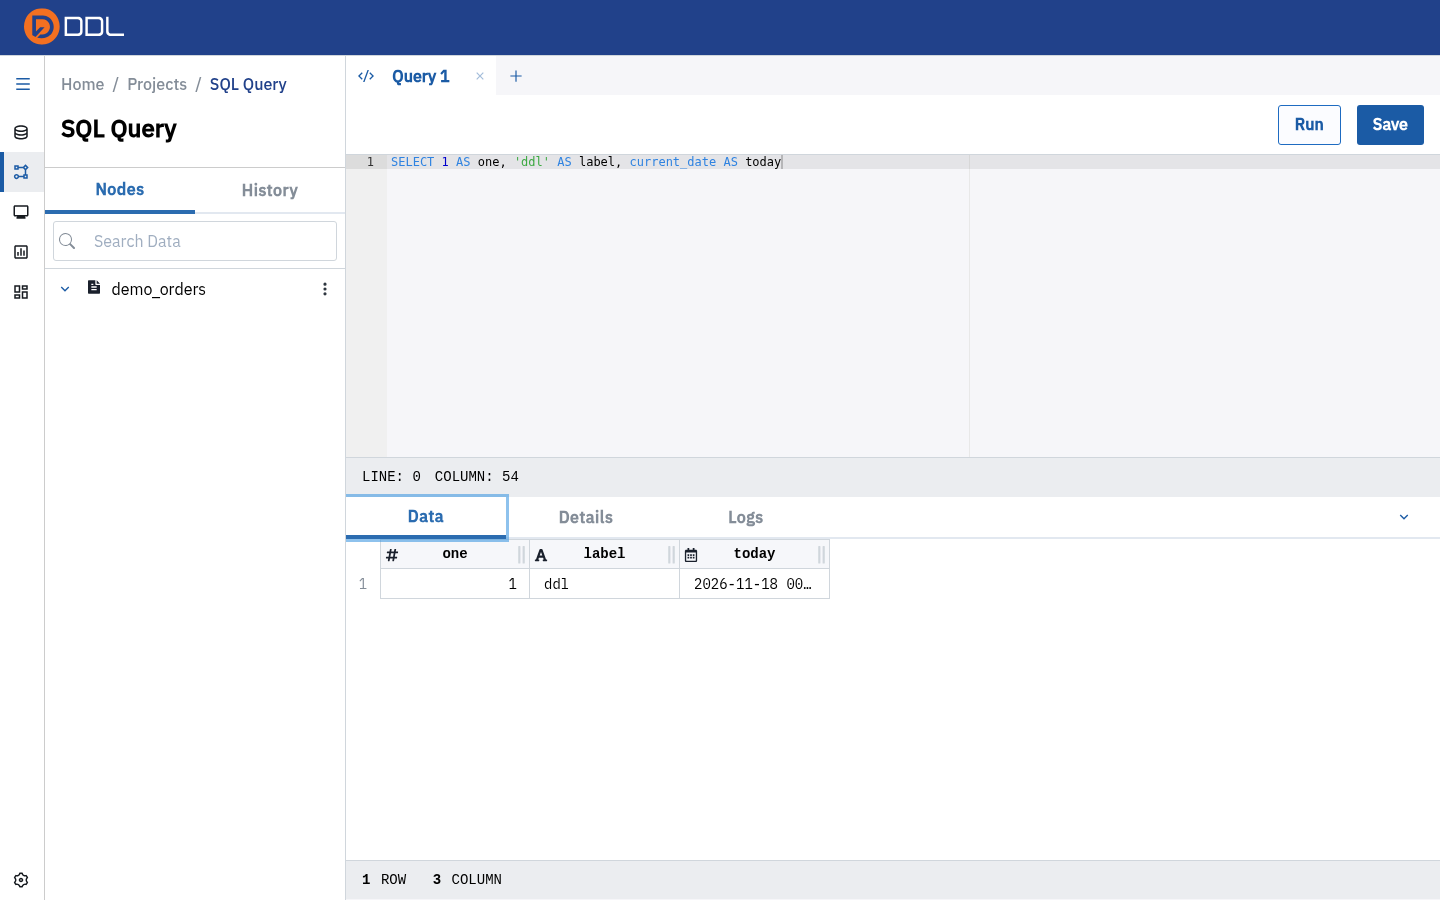 Data tab of a smoke-test query: three columns, one row, and a 1 ROW / 3 COLUMN footer.
 Details tab: Query ID · Total Size · Started At · Status · Duration for the run you just made.
| Tab | Use it for |
|---|---|
| Data | The rows. Footer states N ROW / N COLUMN |
| Details | Query ID, result size, start time, status, duration — quote the Query ID when you ask for help |
| Logs | The technical log, including full tracebacks for failed runs; Refresh Log re-reads it |
Logs is where failures are explained
A red Status in Details plus a traceback in Logs is usually enough to self-diagnose. The same log is mirrored in Monitoring, where you can also share it as a deep link.
The one rule: table names are back-quoted node names
DDL resolves a table only as the node name wrapped in backticks (`), not as a PostgreSQL schema-qualified relation. Four variants of the same query, run in the same project:
| What you write | What happens |
|---|---|
SELECT * from `demo_orders` LIMIT 25 | ✅ Works — 6 rows / 5 columns |
SELECT … FROM demo_orders … (bare name) | ❌ psycopg2.errors.UndefinedTable: relation "demo_orders" does not exist |
SELECT * FROM "demo_orders" LIMIT 5 (double quotes) | ❌ same error |
SELECT * FROM ddl.demo_orders LIMIT 5 (schema-qualified) | ❌ relation "ddl.demo_orders" does not exist |
Working example — the statement DDL itself generates:
sql
SELECT * from `demo_orders` LIMIT 25Aggregate version, same rule:
sql
SELECT customer, SUM(amount) AS total
FROM `demo_orders`
GROUP BY customer
ORDER BY total DESC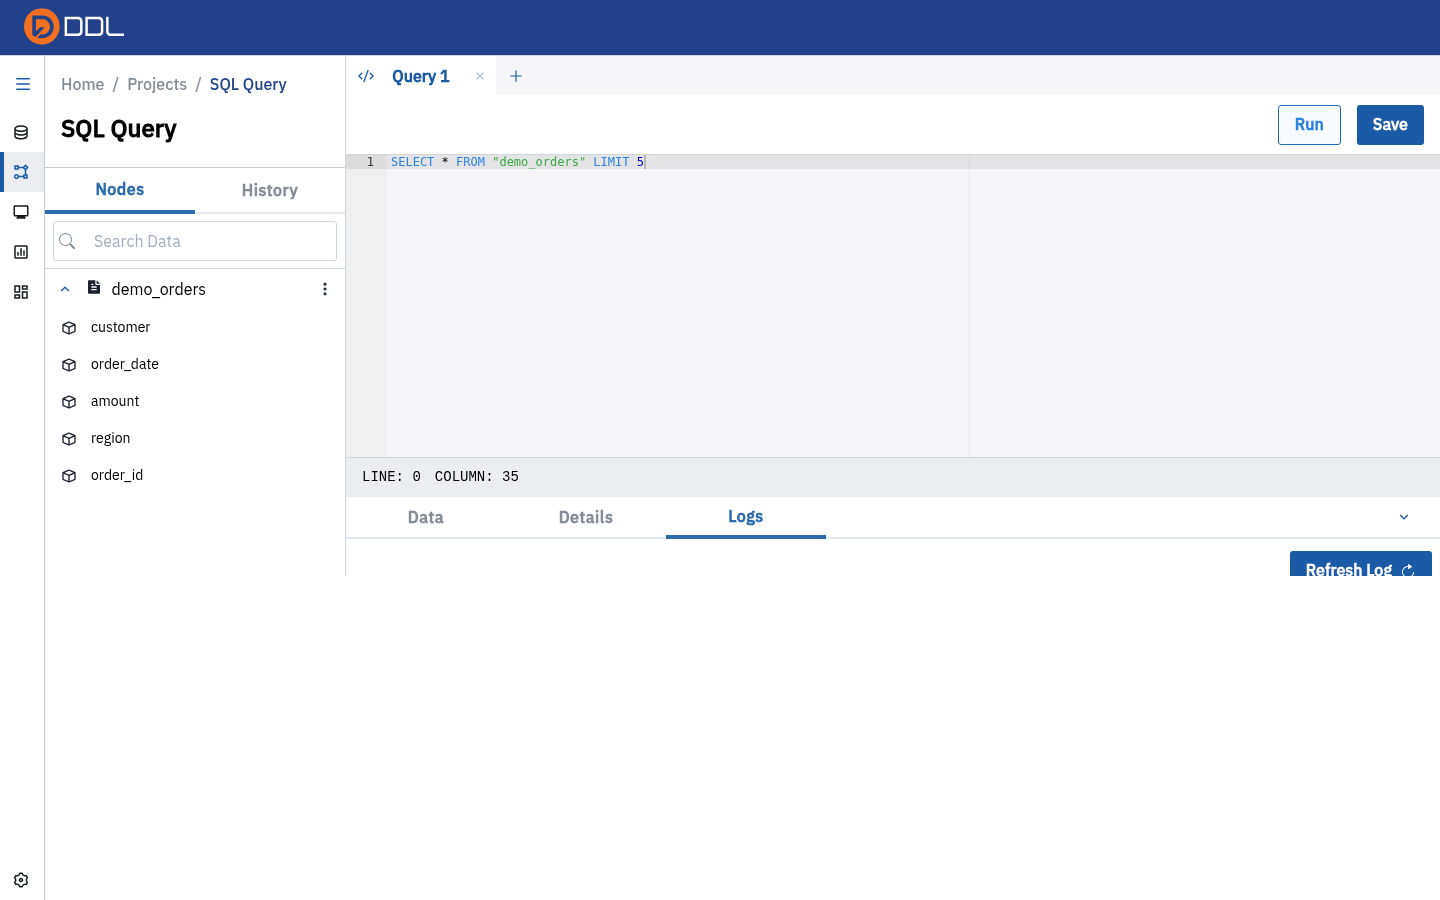 Double quotes are not enough — the run fails with
relation "demo_orders" does not exist even though the node exists.
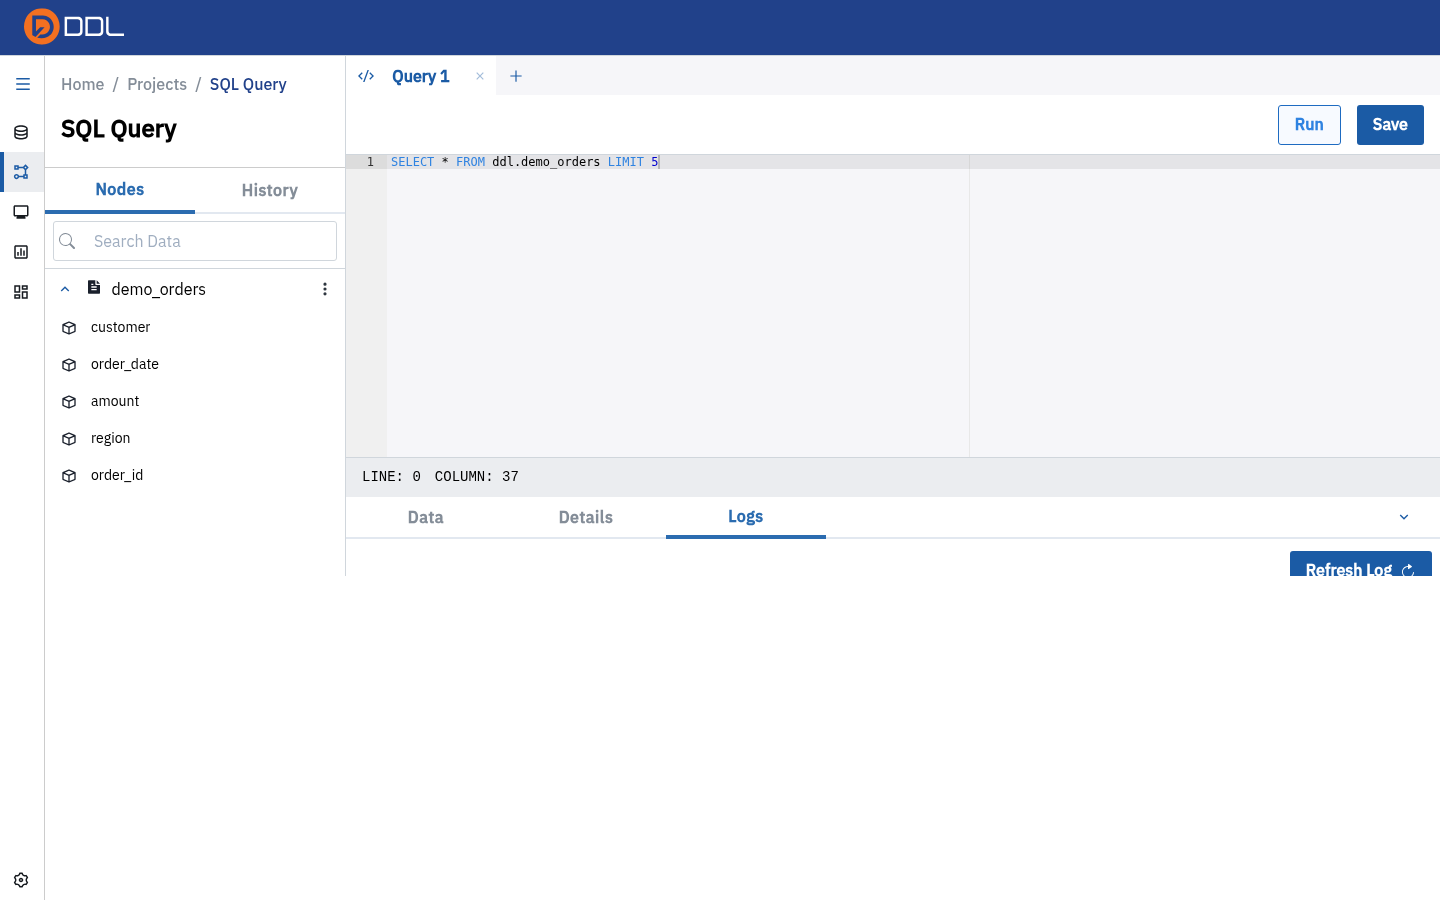 Prefixing a schema (
ddl.demo_orders) fails the same way: relation "ddl.demo_orders" does not exist.
Backticks, not double quotes, not schema.table
This is the single most common cause of "the table doesn't exist" in DDL. The node does exist — you are addressing it in a way the resolver does not accept. Use backticks, or better, let DDL write the name for you with View Data.
The reliable way to get the identifier right
Expand the node in the Nodes panel → ⋮ → View Data. DDL inserts the correct backticked statement in a new tab and runs it. Copy from there when you write your own queries.
Browse data without writing SQL
- In the Nodes panel, expand a node to see its columns.
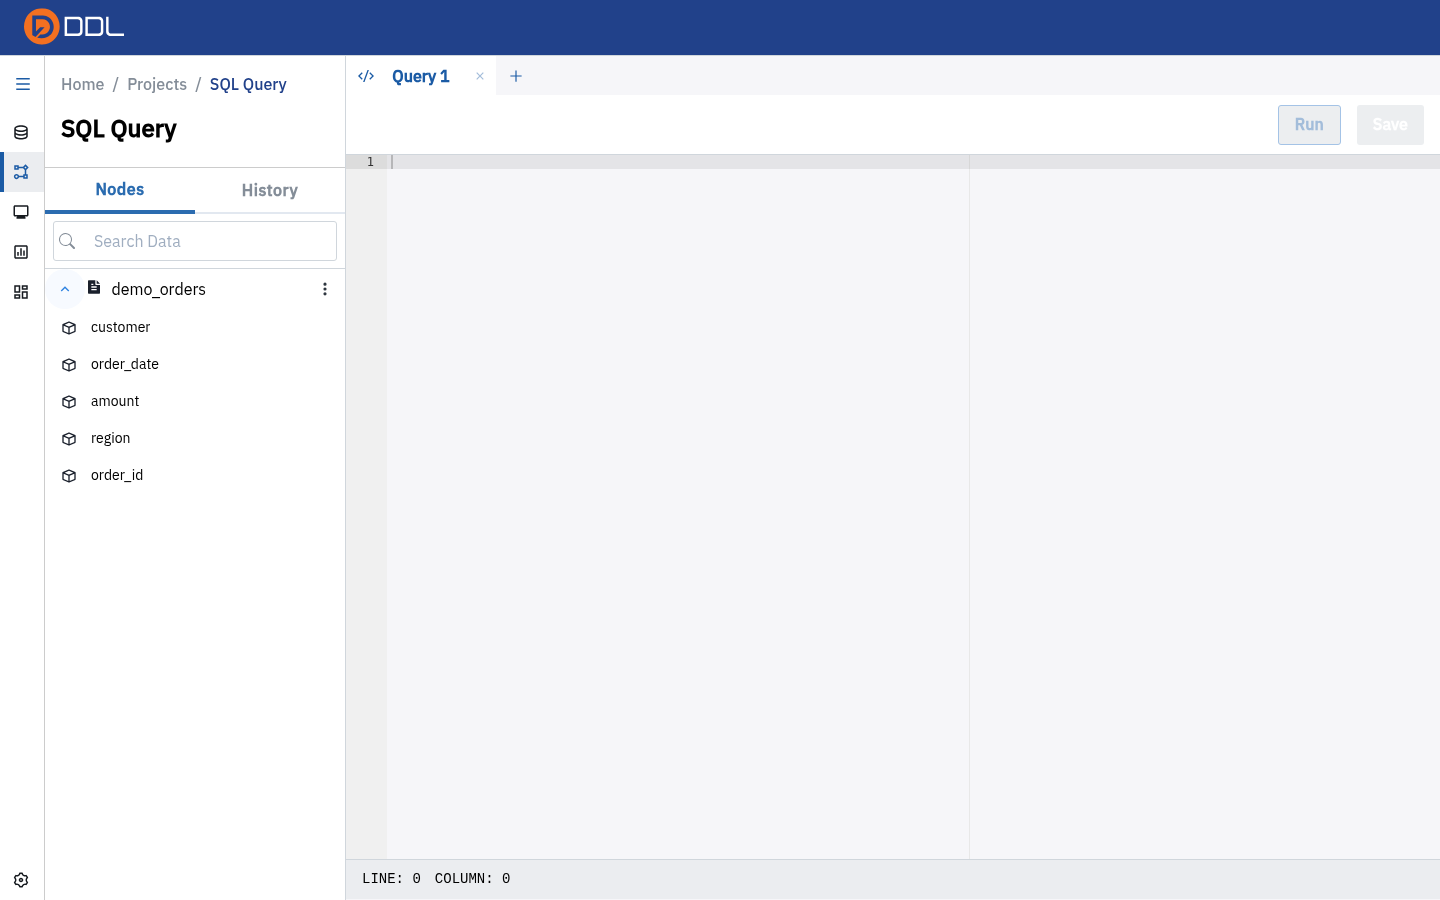 Expanding demo_orders lists its five columns — the quickest type check before you write a query.
- Click the node's ⋮ and choose View Data.
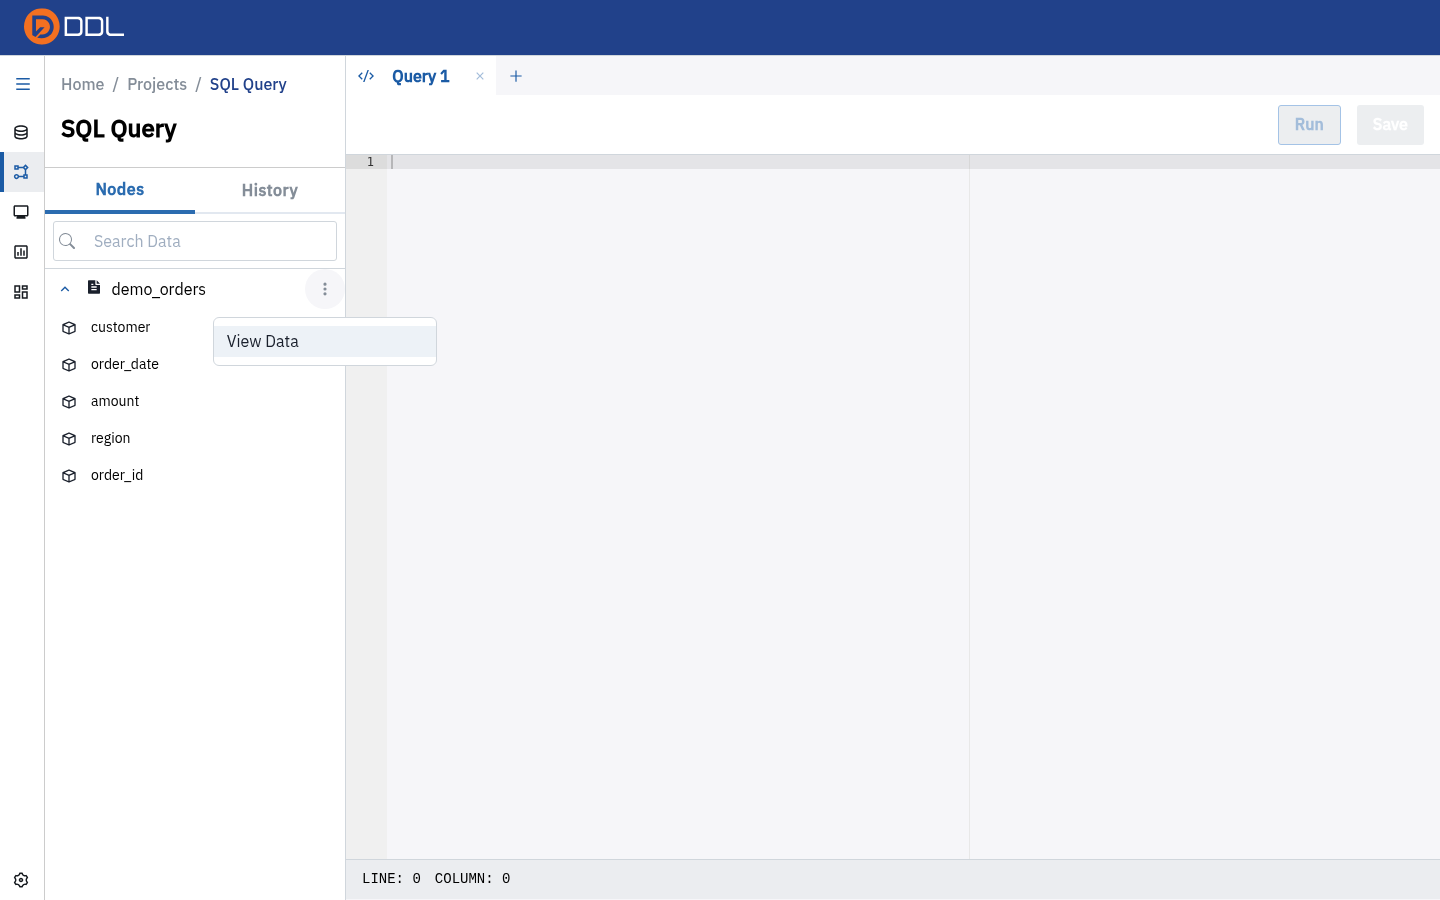 The node menu with View Data .
- A new tab opens, pre-filled and already run.
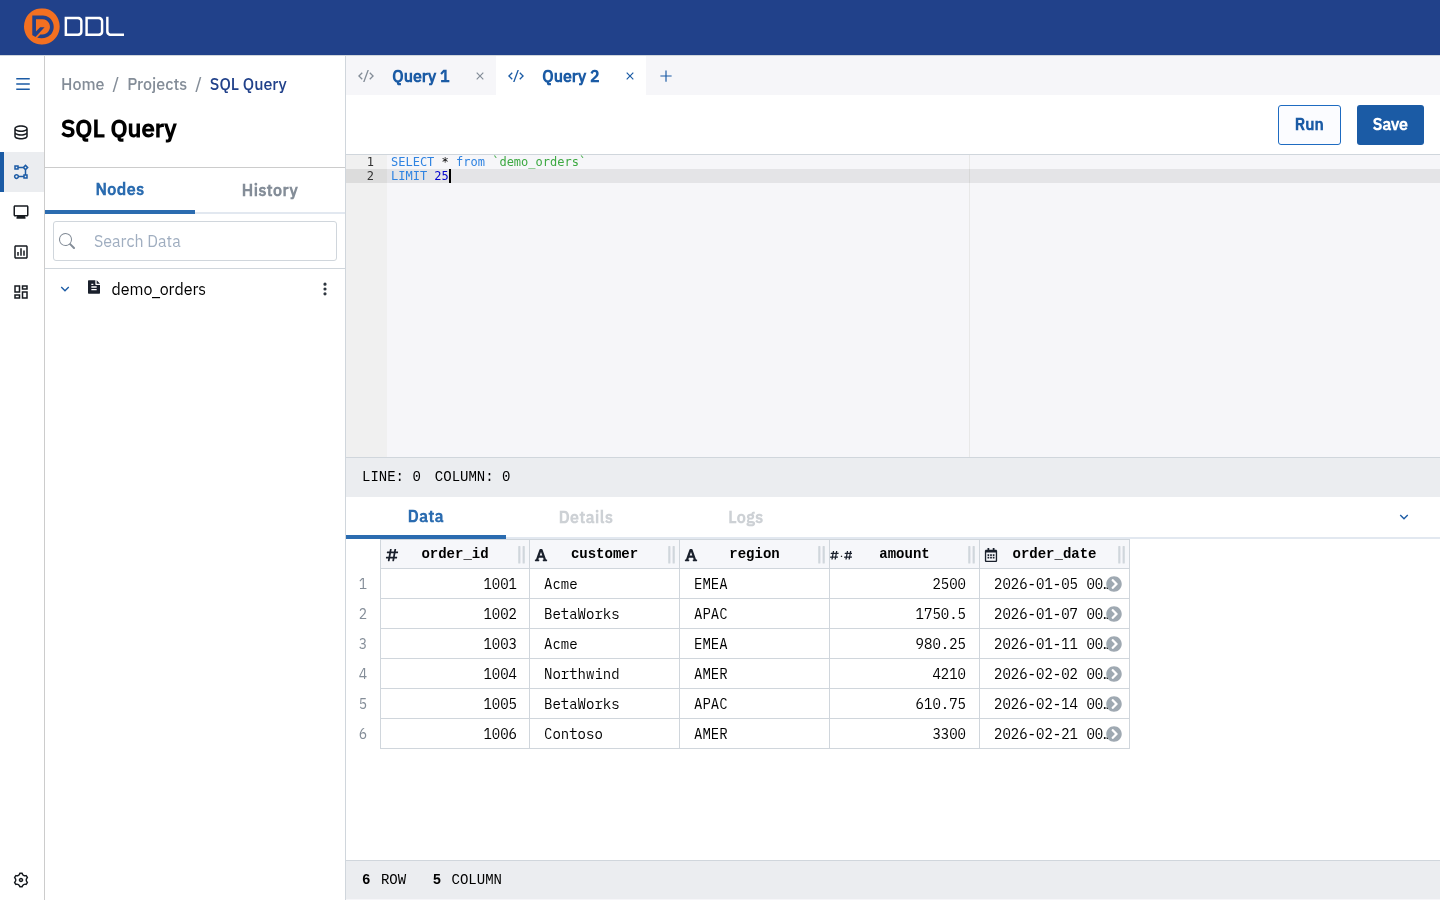 Query 2 contains
SELECT * from `demo_orders` LIMIT 25 — note the backticks.
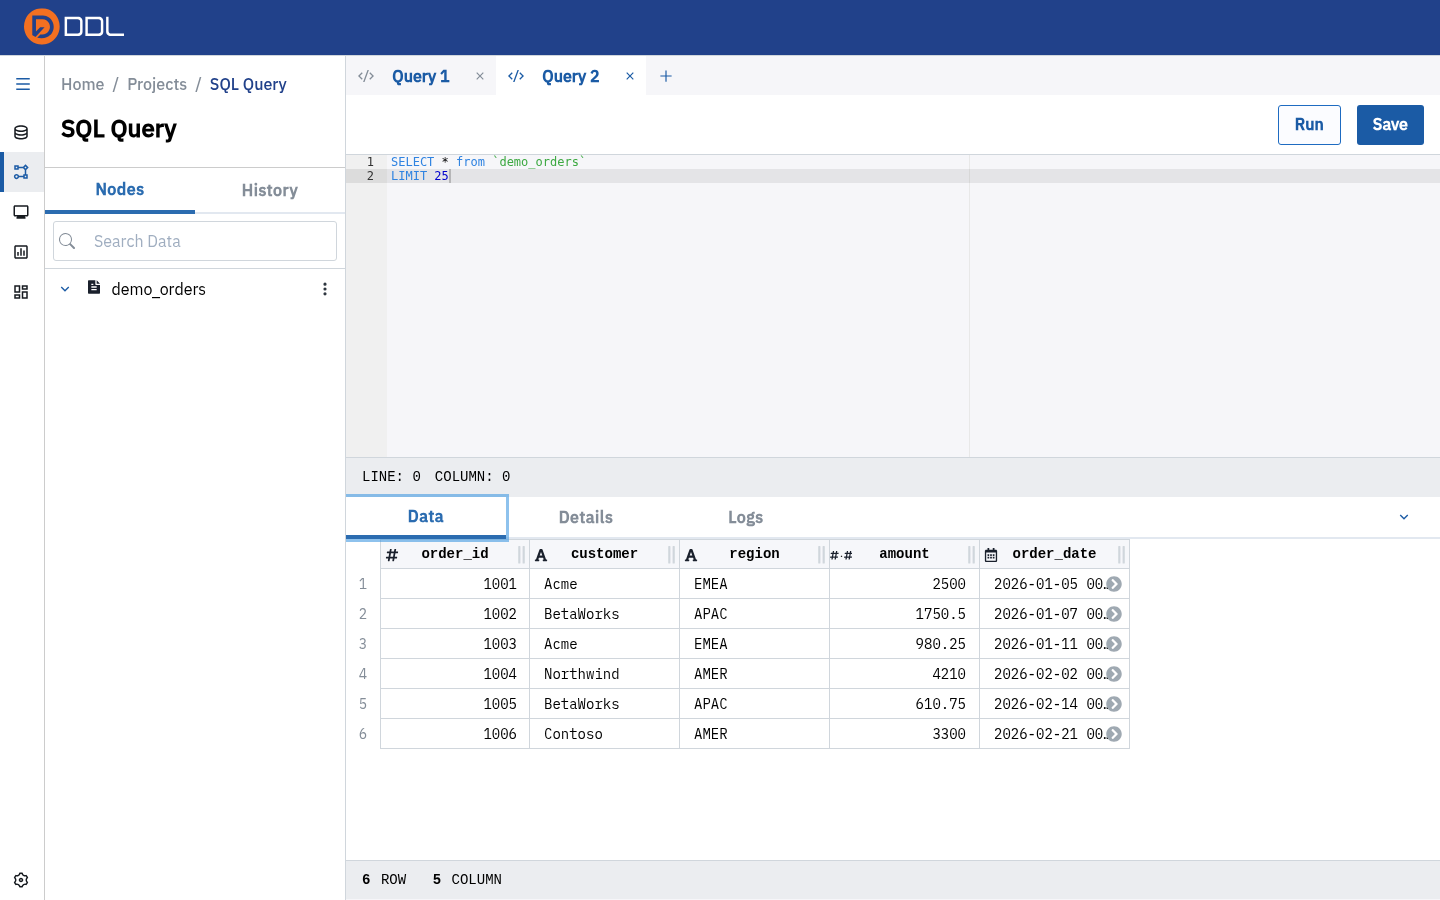 6 ROW / 5 COLUMN: order_id, customer, region, amount, order_date.
Reuse a run from History
The History tab lists your previous executions as cards, each headed by the query UUID and its timestamp.
 Every run, newest first. The UUID matches the Query ID shown in the Details tab and in Monitoring.
TIP
Copy a UUID from History into a bug report or a chat message: support and your own teammates can find the exact run in Monitoring with it.
Save a query as a node
Save turns the current statement into a pipeline node, making it part of the DAG — upstream nodes, lineage, schedules and all.
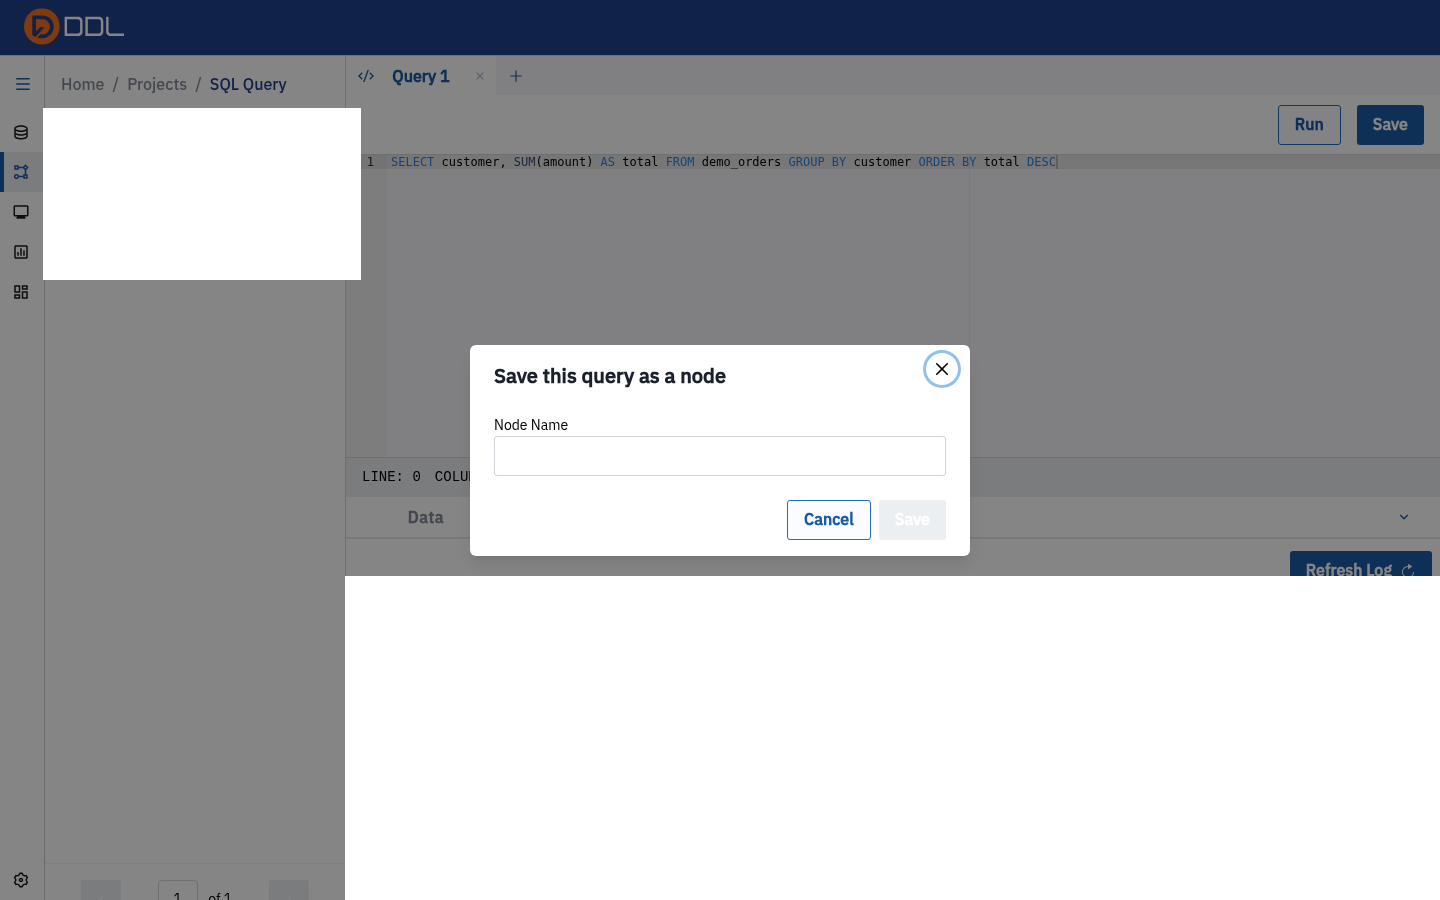 "Save this query as a node" with a single Node Name field and Cancel / Save .
- Make sure the query runs cleanly first (it will be re-executed by the pipeline).
- Click Save, give the node a name that follows your naming convention, confirm with Save.
- The node appears on the canvas; use Sync to refresh it. See Pipelines (ETL).
The node name you choose here becomes a table name
Downstream queries must reference it in backticks. Rename later and every query that used the old name breaks.
What the SQL workbench does not do
Knowing these limits saves you from hunting for a button that isn't there:
- No result export. There is no Download CSV / Export results control on the Data tab. To get data out, save the query as a node and use Transfer or Dump Data.
- No charts from the result grid. Charts and Dashboards are separate project tabs — see Charts & Dashboards.
- No autocomplete or schema tree beyond the Nodes panel, and no SQL formatting button.
- No result pagination for a
LIMIT 25result — you get the rows the query returned. - The LINE indicator is cosmetic. It can read
LINE: 0on a single-line query. - No "Ask AI" control in the editor. Selecting text or right-clicking offers nothing AI-related unless your deployment has the assistant configured — see AI & MCP integration.
Troubleshooting
| Error / symptom | Cause | Fix |
|---|---|---|
relation "…" does not exist | Table name not written as a back-quoted node name | Use `node_name` or View Data |
relation "schema.node" does not exist | Schema-qualified names are not supported | Drop the prefix |
| Query runs but returns 0 rows | Node not synced yet, or filter too tight | Sync now the node, then re-run |
| Column not found | Type or name differs from what you assumed | Expand the node in Nodes to read real column names |
| Long traceback in Logs | Real PostgreSQL error from the warehouse | Read the last line — it names the failing expression |
Next: Schedules · Related: Pipelines (ETL), Monitoring, AI & MCP integration