
Monitoring
Purpose: every executed unit of work in DDL is a process — a SQL query, an import or sync, a transform, an export, a transfer, an upload, an action, a backup, a publish. Monitoring is where you find out whether it ran, how long it took, and what it said when it failed. It is the entry point for "why did this sync fail?".
DDL offers the same log in two scopes:
| View | Where | Extra column |
|---|---|---|
| Global | /monitoring (profile menu → Monitoring) | PROJECT NAME — spans every project you can see |
| Project | Project sidebar → Monitoring (/projects/<id>/monitoring) | — (the project is implicit; the browser tab title becomes DDL - <project>) |
The list
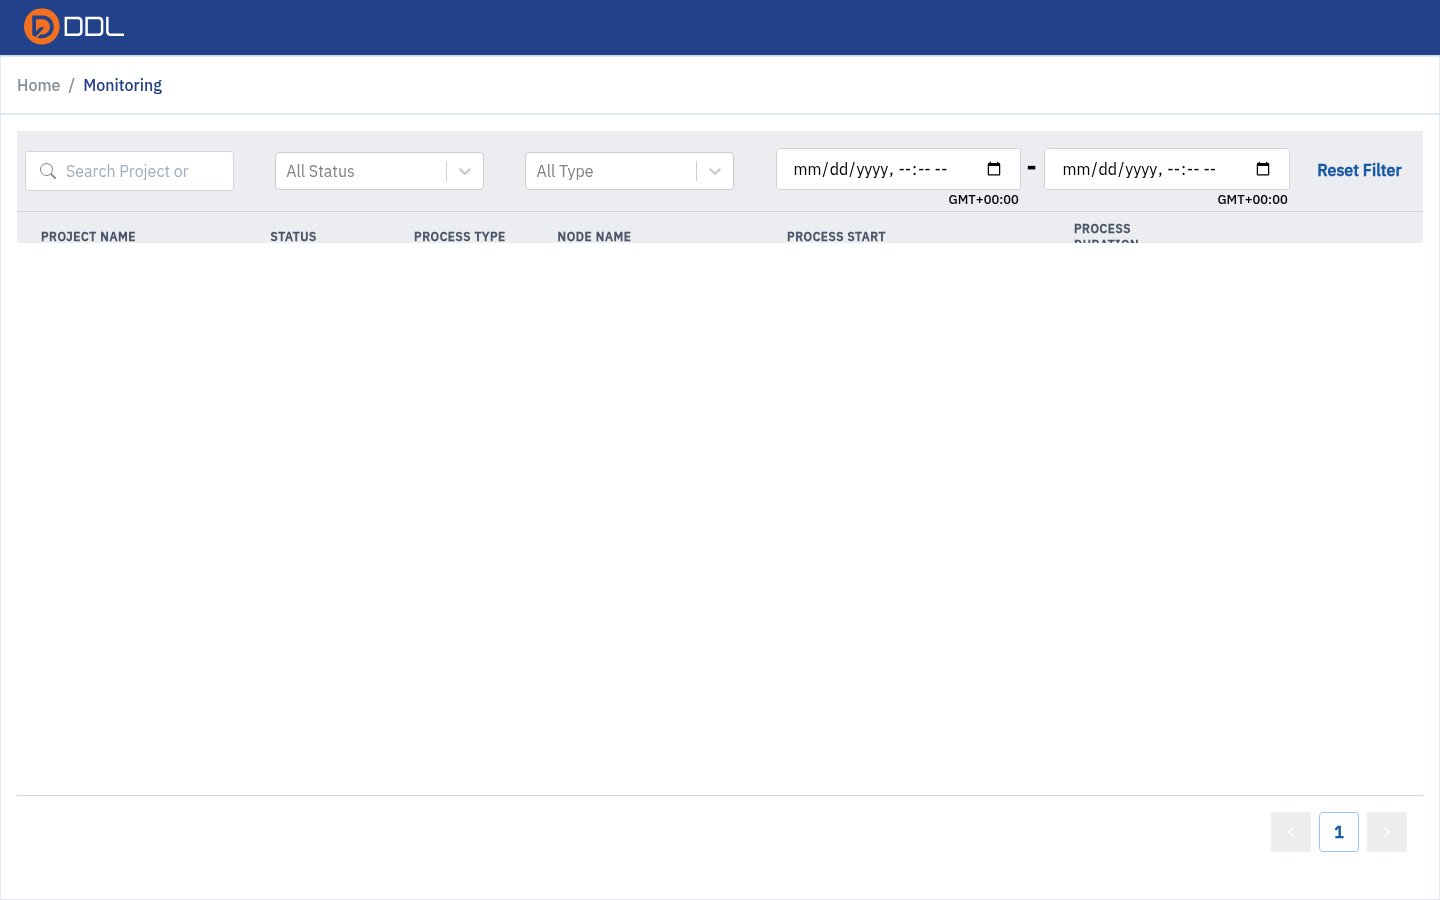 Global view: PROJECT NAME · STATUS · PROCESS TYPE · NODE NAME · PROCESS START · PROCESS DURATION — here with both successful and failed SQL Query rows.
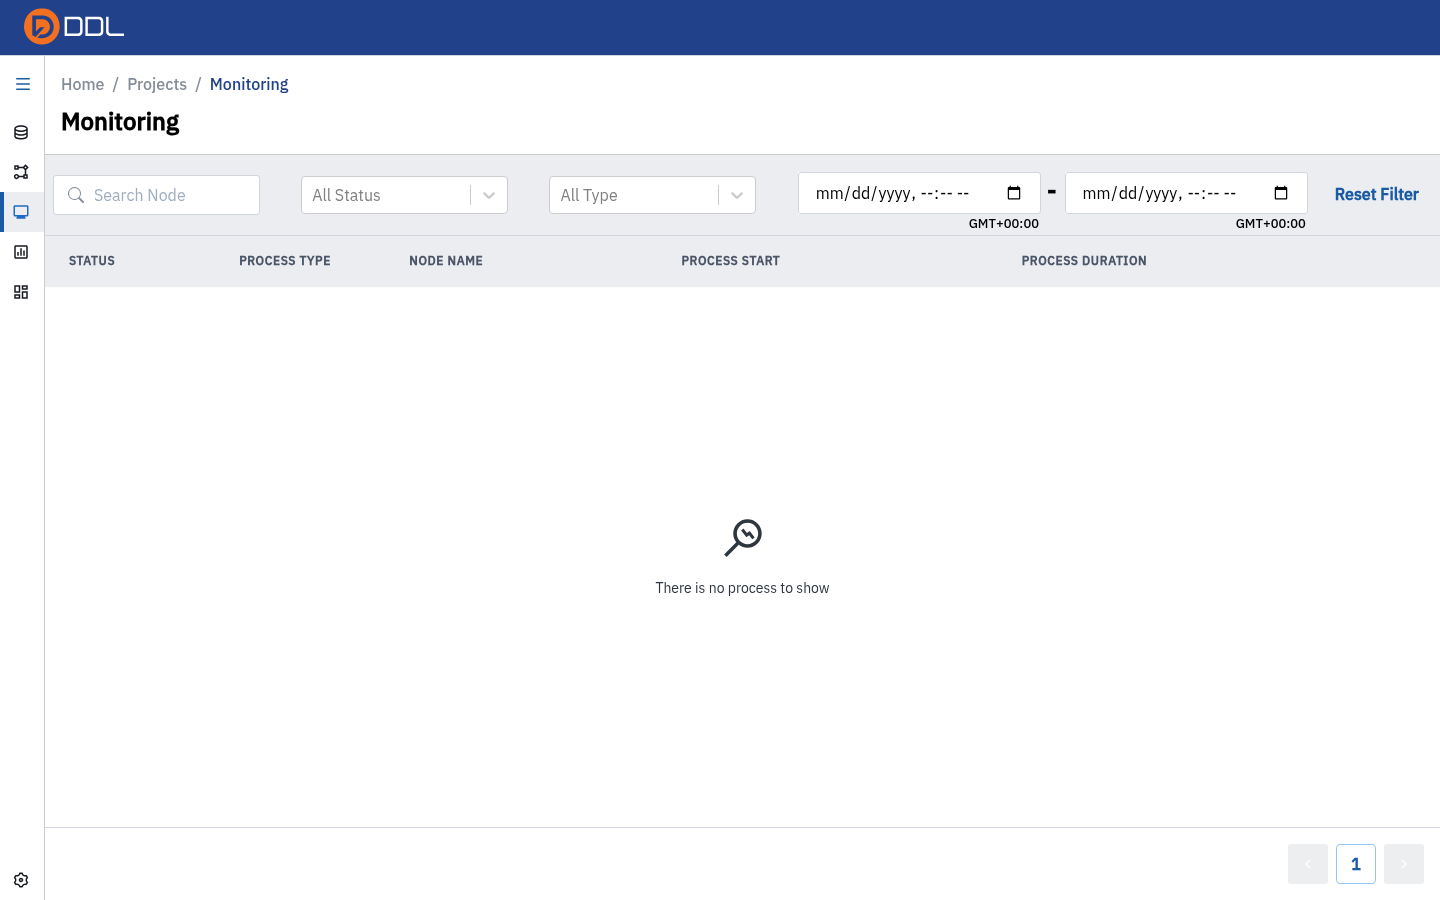 The same data in project scope, without the project column.
 SQL Query runs recorded against the project.
| Column | Notes |
|---|---|
| STATUS | Colour-coded: Pending / Running / Success / Failed / Upstream Failed |
| PROCESS TYPE | Action / Backup / Export / Import / Publish / SQL Query / Transfer / Transform / Upload File |
| NODE NAME | The node the process belongs to. Empty for SQL runs launched from the editor — those are not tied to a node |
| PROCESS START | Rendered as relative time ("15 minutes ago") |
| PROCESS DURATION | Sub-second runs display 0 seconds |
| Last cell | View Log |
An account with no runs yet shows "There is no process to show".
Filter to what you need
The filter bar is identical in both views.
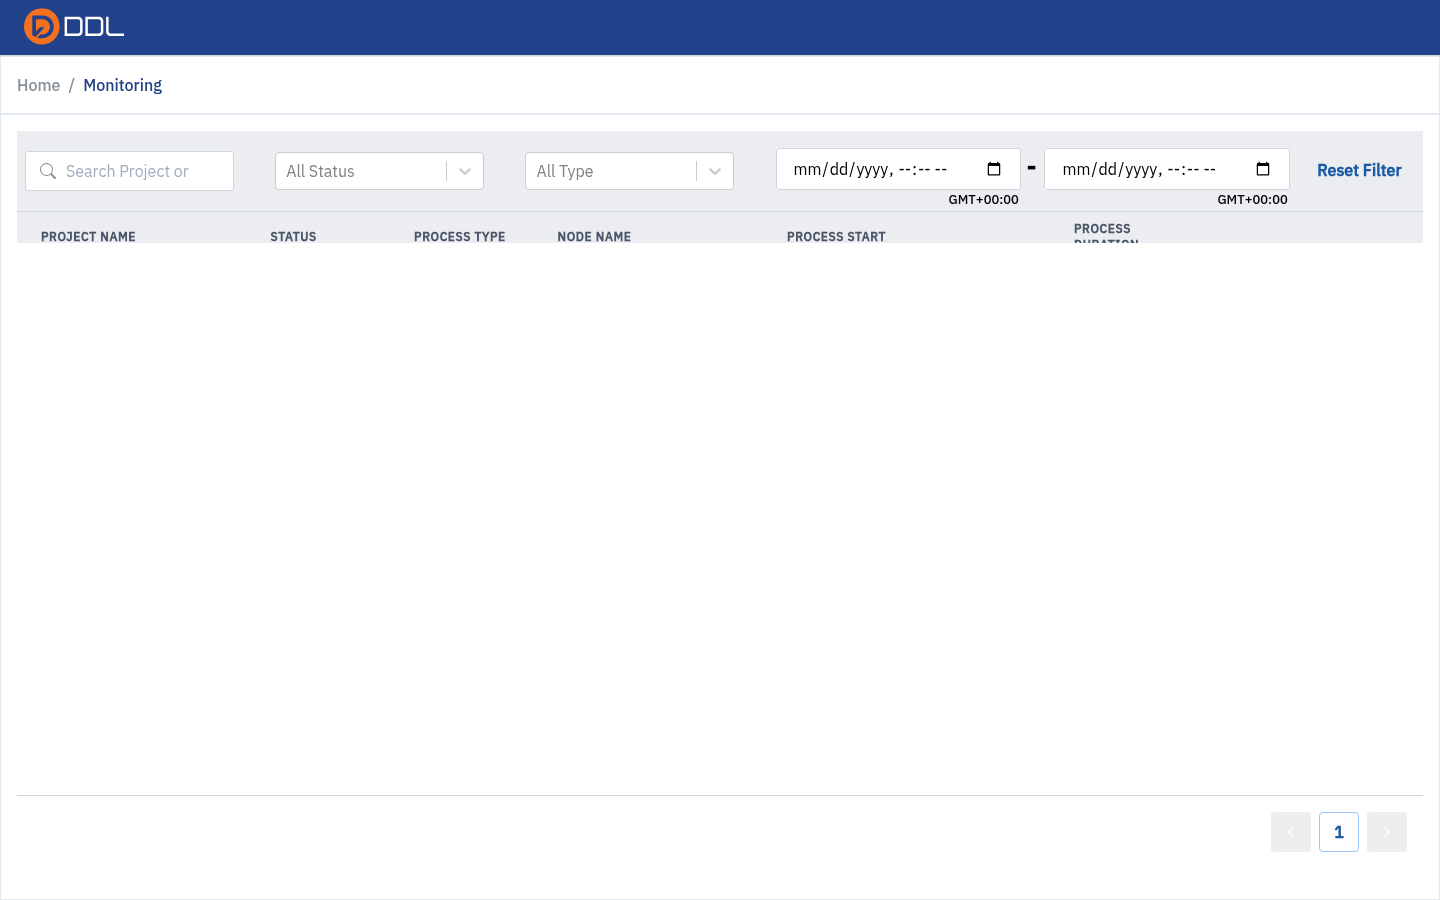 Status filter, process-type filter, a start and end datetime range (both labelled GMT+00:00), and Reset Filter .
- Open the status filter.
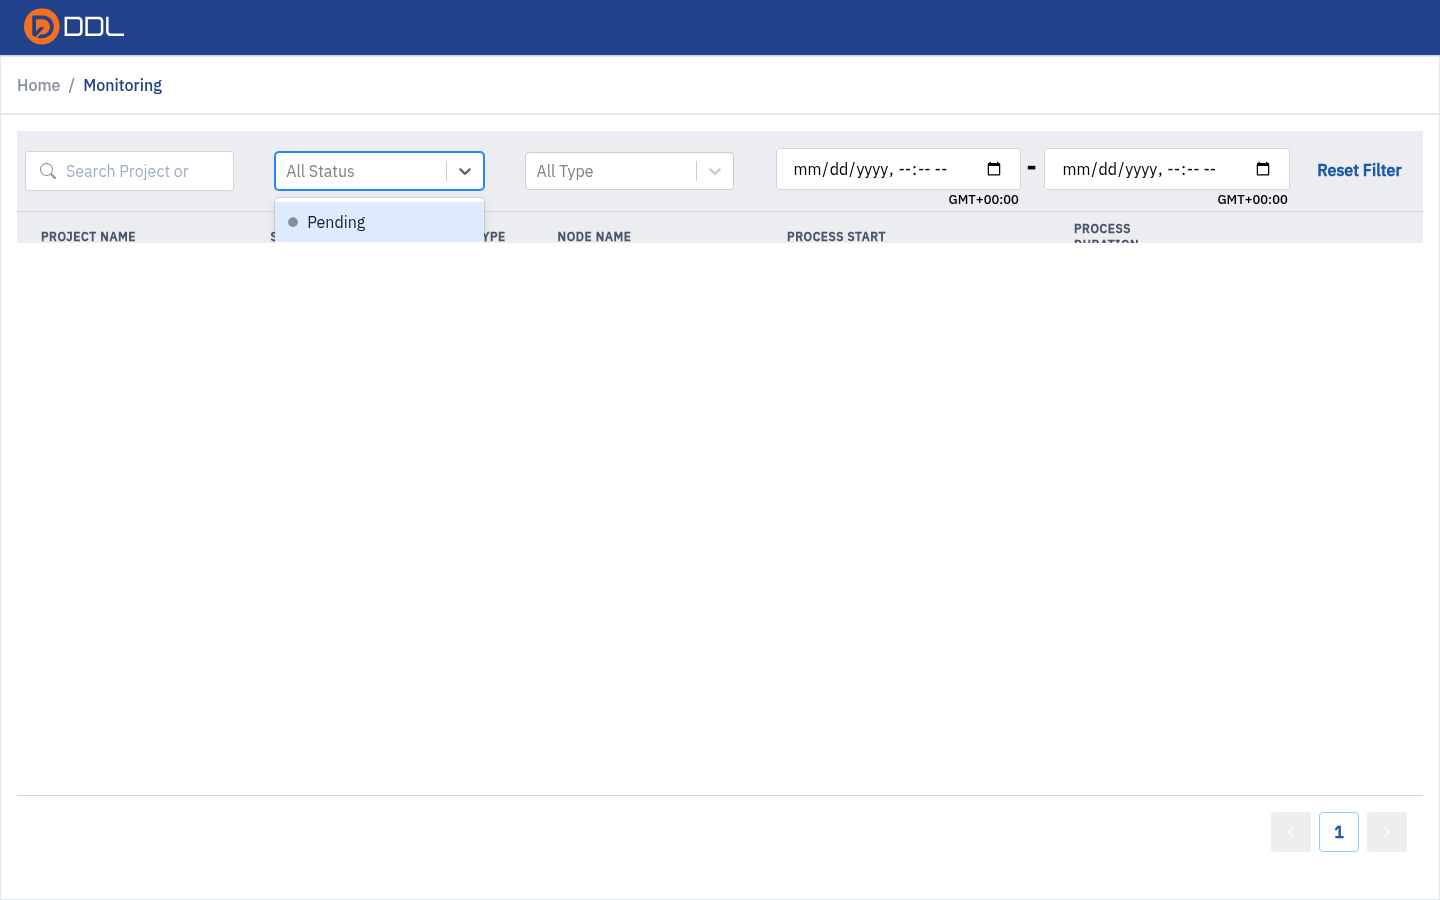 The status dropdown.
Its exact options:
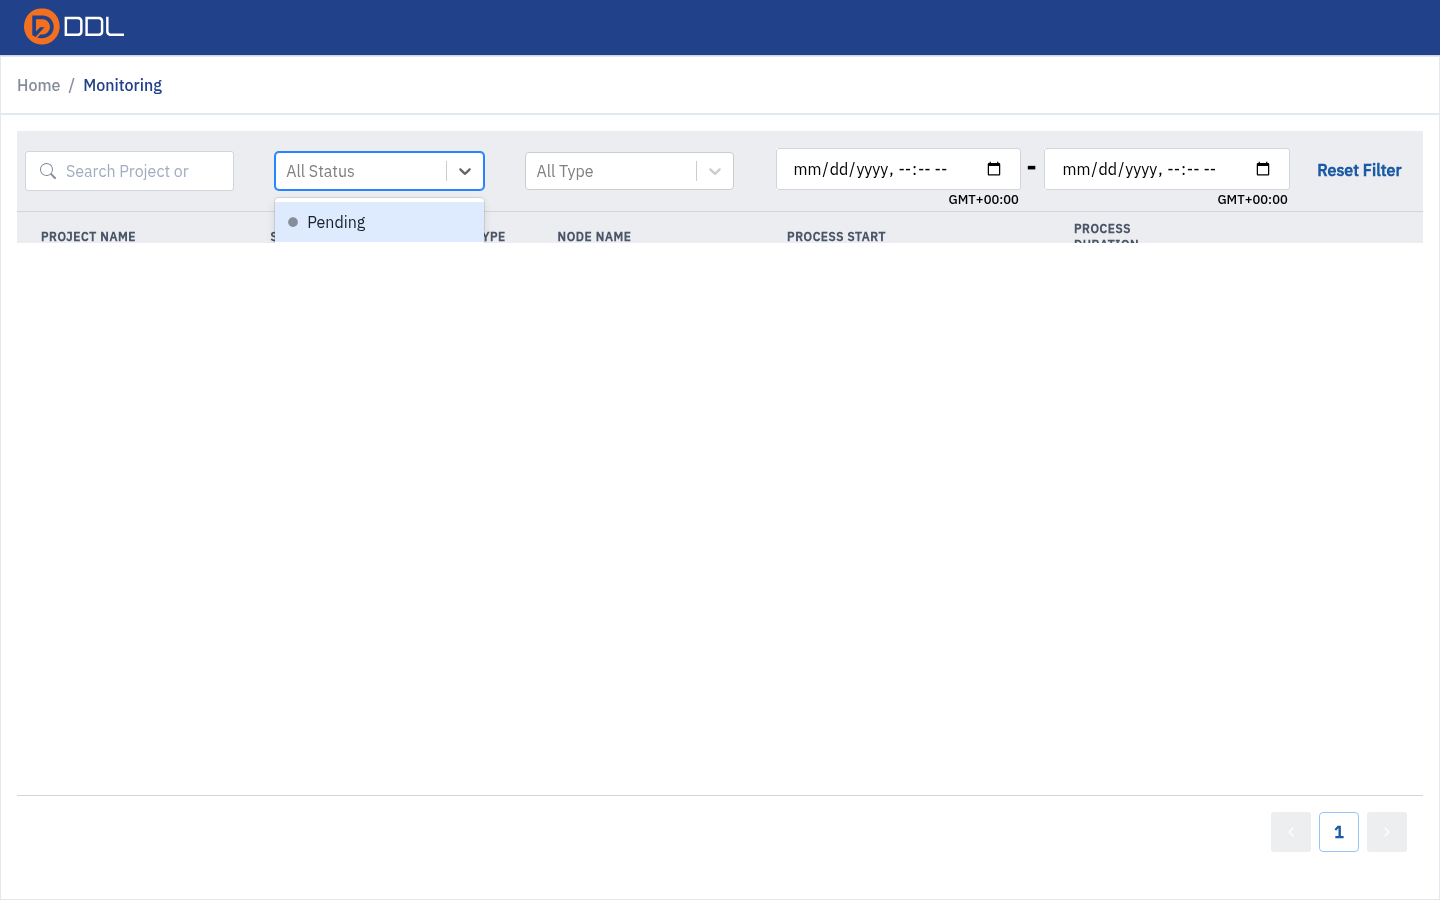 Pending · Running · Success · Failed · Upstream Failed.
Open the process type filter.
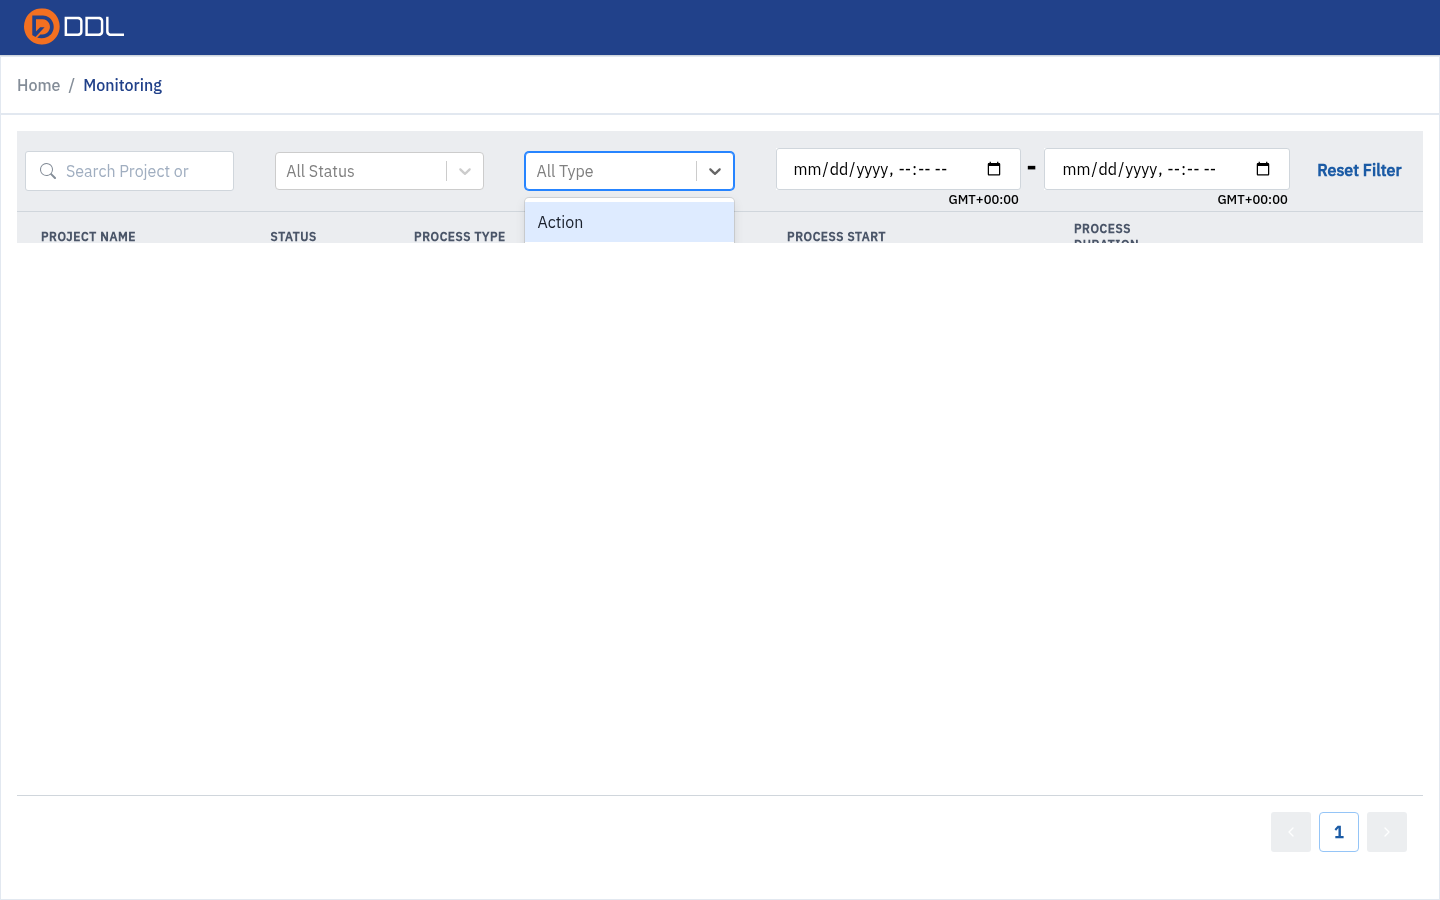 The type dropdown.
Its exact options:
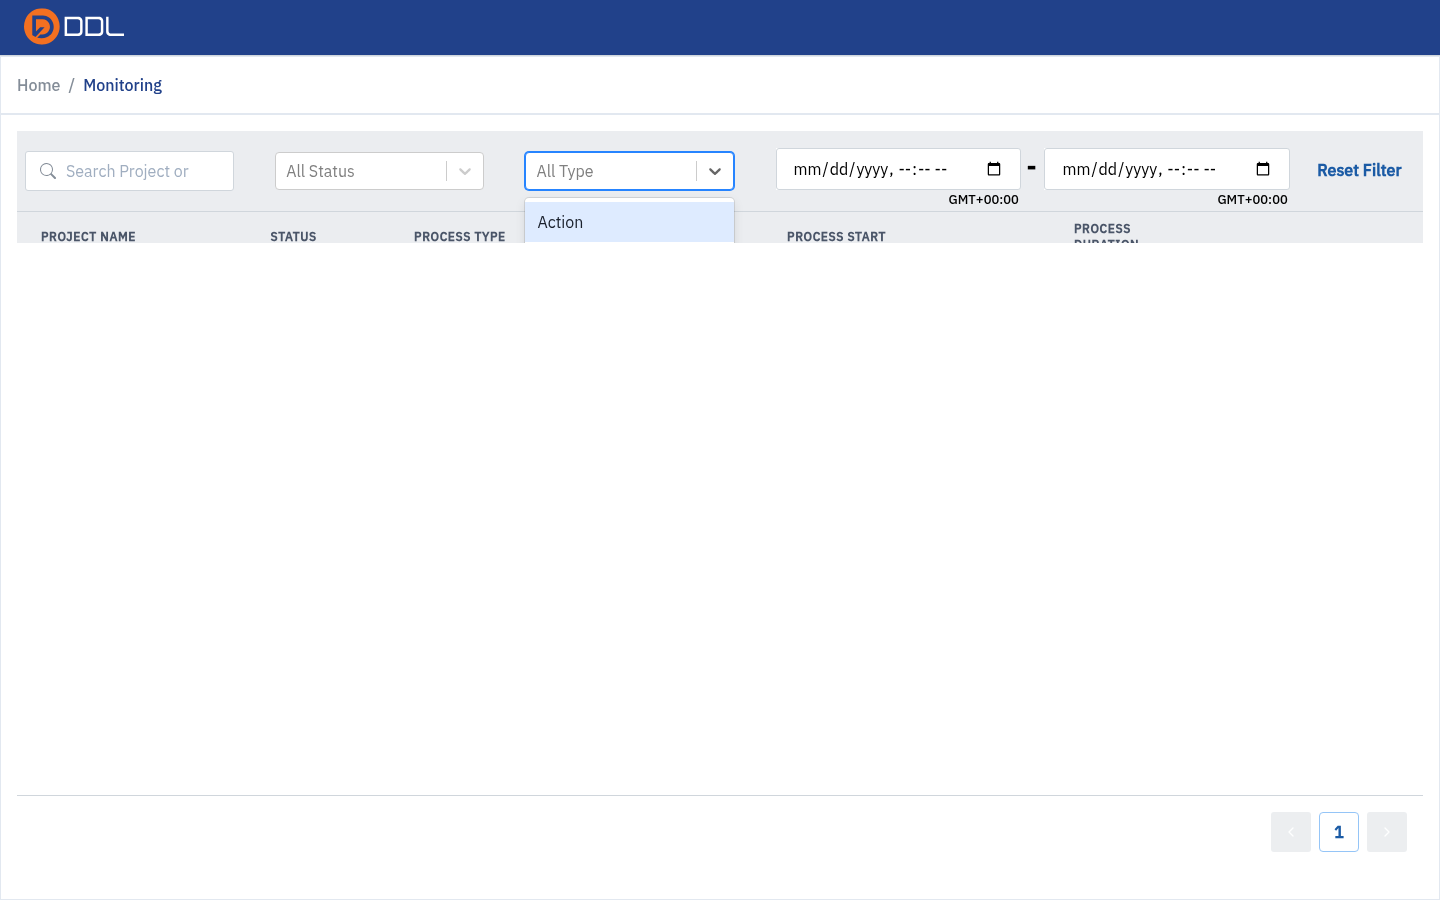 Action · Backup · Export · Import · Publish · SQL Query · Transfer · Transform · Upload File.
Narrow the window with the two
datetime-localrange inputs, and clear everything with Reset Filter.
"Upstream Failed" is a hint, not a mystery
It means the process never got to run because something it depends on failed. Start at the upstream node's own failed row — the Lineage view tells you which node that is.
Read a process log
- Click View Log on a row (or click the row itself).
 The drawer: process metadata at the top, Download Log , and the technical log below.
Read the metadata block:
Field Example Process the process UUID Process Type Sql QueryProcess Status SuccessNode Name -when the run is not tied to a nodeProcess Start / Process End relative times Process Duration 0 secondsfor sub-second runsRead the technical log — "Complete technical details for further investigation" — a terminal block with timestamped lines:
text2026-11-18 05:28:47,245329 | root/INFO | Starting sql query e1945b89-71ab-4068-ac1f-bd46759dc92e (PID: 4437f375-bfcd-4190-8fef-26823d4938ad) 2026-11-18 05:28:47,508883 | root/INFO | Sql query e1945b89-71ab-4068-ac1f-bd46759dc92e is completed successfullyUse Download Log to attach the full log to an incident ticket, and copy the URL to share the exact view.
The log drawer is deep-linkable
Opening a log rewrites the URL to /monitoring?process_id=<uuid>&page=1. Reload it, or send it to a colleague with access, and the same drawer opens on the same process. This is the best way to ask a question about a failed run.
Diagnose a failed run (worked example)
A failed SQL run is the clearest case, because the error tells you exactly what went wrong:
text
psycopg2.errors.UndefinedTable: relation "demo_orders" does not exist
utils.exceptions.QueryError: Query fails: …- Find the Failed row in Monitoring (status filter →
Failed). - Open View Log and read the last line of the technical log.
- Match the error to its cause:
| Error in the log | Cause | Fix |
|---|---|---|
relation "…" does not exist | Table name was not written as a back-quoted node name | Use `node_name` — see SQL Query |
relation "schema.node" does not exist | Schema-qualified name | Drop the prefix |
| Import/transfer failure with a connection name | Credentials, permissions or network reachability | Test the connection — see Connections |
Upstream Failed | A node upstream did not succeed | Fix the upstream node first |
- Re-run: there is no retry button inside the log drawer. Re-run the query from the SQL editor, or use Sync now on the node — Pipelines (ETL).
Behaviour worth knowing
Monitoring is eventually consistent
Right after a Sync now, the list may still read "There is no process to show". Wait and refresh rather than launching the run again.
Only your visible work appears here
Monitoring lists runs made by/for you within the projects you can access. Instance-wide totals are elsewhere: Settings → Storage Usage, Settings → Process Usage and — for AI — Settings → AI → AI Ops. A number that looks too big usually means you are looking at an aggregate page, not at Monitoring.
Timestamps are relative here, absolute elsewhere
Monitoring renders "15 minutes ago" in both the list and the drawer; the absolute timestamp only appears inside the log body. Storage Usage and Versions use absolute times. If you are correlating a run with an external log, take the time from the technical log lines.
Next: AI & MCP integration · Related: Pipelines (ETL), SQL Query, FAQ